PPRS and devolution: over £60m to Greater Manchester?
Pharmaceutical Price Regulation Scheme (PPRS) payments have exceeded £1 billion to date, but does the local NHS in England get its fair share? Will devolution in health encourage transparency about where those PPRS monies go? Leela Barham investigates.
The PPRS – one of the measures regulating the prices charged for branded medicines bought by the National Health Service (NHS) in England – included a brand new feature in its 2014 iteration: for the first time, the total spend of the NHS on branded medicines was limited via negotiated growth rates for the branded medicines bill.
Now, if negotiated growth rates are exceeded, pharma companies (with exceptions for small companies and those who don’t join the voluntary PPRS, for example) make payments every quarter to the Department of Health (DH).
PPRS payments exceed £1 billion
Growth rates were set at zero for 2014 and 2015, followed by 1.8% in 2016 and 2017 and 1.9% in 2018. With zero growth allowed, PPRS payments made have now reached £1,296 million, rising steadily over time. However that trend broke in the first quarter of 2016 (Figure 1).
Figure 1: PPRS payments, Q1 2014 to Q1 2016 (£m)
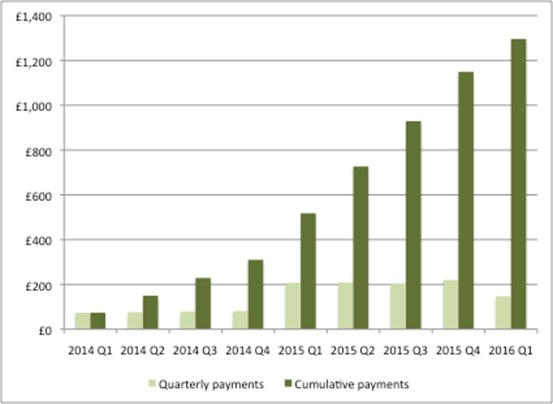
Source: Analysis of DH 2014 Pharmaceutical Price Regulation Scheme (PPRS) Aggregate Net Sales and Payment Information 21 August 2015, DH 2014 Pharmaceutical Price Regulation Scheme (PPRS) Aggregate Net Sales and Payment Information 17 February 2016, DH 2014 Pharmaceutical Price Regulation Scheme (PPRS) Aggregate Net Sales and Payment Information 19 May 2016.
Where does the money go?
The PPRS monies received are split across the devolved nations (Figure 2). The DH uses primary care data on spend on licensed branded medicines to allocate the money. This data is used because it is the most consistent data set available across the UK.
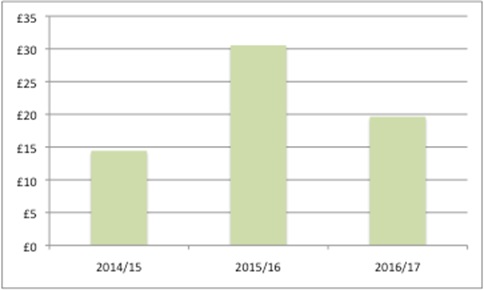
Figure 2: Actual and expected PPRS payments by devolved nation, financial years 2014/15 and 2015/16 (£m)
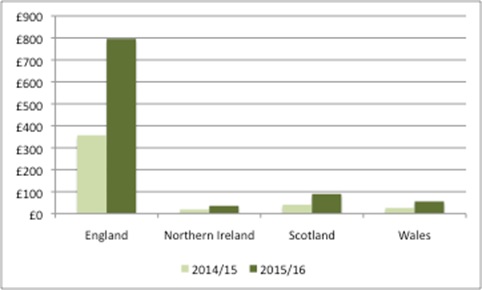
Source: DH Pharmaceutical Price Regulation Scheme 2014: revised forecasts and profile of payment percentages at December 2015 provides actual PPRS payments to devolved nations, and Response to Freedom of Information requests provides estimated PPRS payments to devolved nations.
Each devolved nation then decides how to divide up its allocation of PPRS money.
In England, NHS England (NHSE) stated, in response to a Freedom of Information request, that ‘PPRS funding is not separately identified or ring-fenced in allocations to CCGs [Clinical Commissioning Groups] or specialised commissioning. Rather, expected PPRS payments are factored into NHS England’s overall budget by the DH. The funding is thus included within overall allocations to commissioners.’ That means it reaches NHSE, but from there it is unclear exactly how much goes to the local NHS.
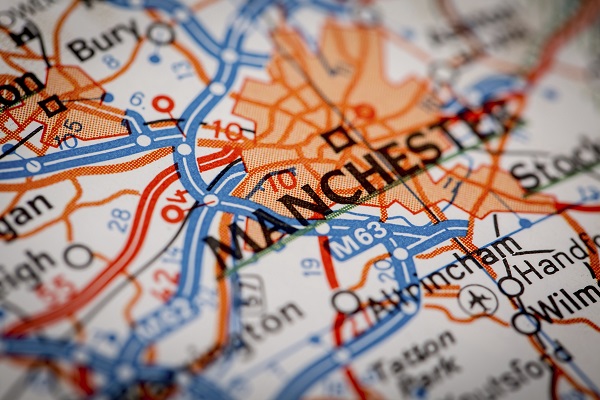
The local NHS in England has a natural interest in where the monies flow. Simon Wootton, chief operating officer of North Mancester CCG, has been credited with saying that, “I know in north Manchester we haven’t got that PPRS money back into the local NHS.” Greater Manchester took on responsibility for health and social care from April 2016. That translates into the challenge of meeting the needs of 2.8 million people within a £6 billion budget. Greater Manchester’s hospitals faced a £114m deficit as at January 2016 so, against this backdrop, every penny counts.
Potential scale of local PPRS payments
If a simple apportionment is used, it’s possible to hypothesise the potential scale of PPRS funding for CCGs (Table 1 and Figure 3). This makes a number of assumptions:
- PPRS payments are split between NHSE and CCGs because NHSE provides services, including medicines, in line with the split of resourcing currently used/planned and not all PPRS monies flow to CCGs; and
- PPRS payments for CCGs are split between CCGs in line with the split of total allocations currently used/planned. This is in line with the statement by NHSE that funding is included within overall allocations to commissioners.
- No adjustments are made in-year, when actual PPRS payments are more/less than expected.
These assumptions may be pragmatic but, because of the lack of transparency, they may not be a fair reflection of what has happened. Could NHSE have top-sliced? Or (less likely) been more generous and passed on more than its share of specialised commissioning implies?
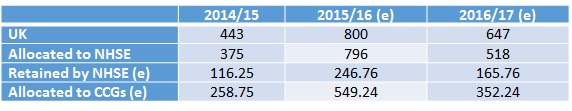
Table 1: Hypothetical distribution of PPRS monies, 2014/15 to 2016/17 (£m)
Source: Analysis using DH, Pharmaceutical Price Regulation Scheme 2014: revised forecasts and profile of payment percentages at December 2015, February 2016;
NHSE, Allocation of resources to NHS England and the commissioning sector for 2014/15 and 2015/16 Board Paper, December 2013;
NHSE, NHS allocation of resources to NHS England and the commissioning sector for 2015/16 Board Paper, December 2014;
NHSE, Allocation of resources to NHS England and the commissioning sector for 2016/17 to 2020/21 Board Paper, December 2015;
NHSE, Summary of CCG allocations 2014/15 and 2015/16, December 2014; and NHSE, Summary of CCG allocations 2015/16 to 2020/21, January 2016.
Notes: In 2014/15 and 2015/16 NHSE allocated 69% of total funds to CCGs; in 2017/18 NHSE proposes to allocate 68% of total funds to CCGs. No forecasts are available yet beyond 2016/17 for PPRS monies. (e) = estimated figure. Expected PPRS payments were used in allocations to NHSE, but actual payments have been lower. DH and NHSE are working together to manage reduction in PPRS payments compared to original forecasts.
Figure 3: Hypothetical distribution of PPRS monies to individual CCGs, 2014/15 to 2016/17 (£m)
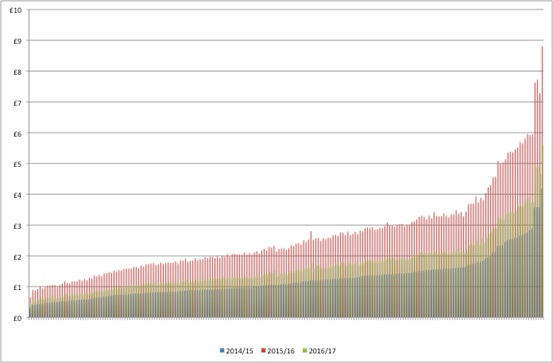
Source: As for Table 1.
While allocations to CCGs on an annual basis are small in absolute terms, taking a regional perspective (naturally) makes the contributions material. For example, allocations to Greater Manchester could have reached over £64 million from 2014/15 to 2016/17 (Figure 4).
Figure 4: Hypothetical distribution of PPRS monies to Greater Manchester, 2014/15 to 2016/17 (£m)
Source: As for Table 1.
Questions remain
Greater transparency in allocation of PPRS monies and their distribution between NHSE and CCGs would help to address questions of whether the local NHS is receiving its ‘fair share’. As Simon Wootton notes, “it is difficult to see from the baseline details and different thresholds how [PPRS] money is allocated.”
Some, like Leslie Galloway from the Ethical Medicines Industry Group (EMIG), have called for PPRS payments to be spent on medicines. At a pharmaphorum and IMS Health webinar he said, “We need specific funding for new medicines that can come from … all the rebates that we pay as part of the PPRS.” That would be a somewhat circular option and could risk embedding future PPRS payments, but it is the approach taken in Scotland, with its new medicines fund paid for from the Scottish share of PPRS payments.
The 2014 PPRS is due to end on 31 December 2018. Negotiations on a successor are likely to start next year. There may be scope to explore some of the questions that remain about PPRS payments, such as how best to allocate PPRS monies. Should this be on the basis of total allocations – as applied in this analysis – or should it be on spend more closely related to medicines? Could allocations be distributed in a way that would incentivise optimal prescribing at the local level?
Plus, the bigger question is whether the next PPRS will keep PPRS payments at all.
About the author:
Leela Barham is an independent health economist and policy expert who has worked with all stakeholders across the health care system, both in the UK and internationally. Leela works on a variety of issues: from the health and wellbeing of NHS staff to pricing and reimbursement of medicines and policies such as the Cancer Drugs Fund and Patient Access Schemes. Find out more here and contact Leela on leels@btinternet.com.
Read more from Leela Barham: