Simple steps to better communicate NHS medicines spend
Leela Barham says that there’s a communication problem when it comes to one of the most important and basic statistics about medicines in the UK: how much the UK spends on them.
If you look at official sources you can easily find the total cost of medicines at list prices bought in England (and England is the focus here simply because it’s the dominant market in the UK). NHS Digital routinely publishes prescribing costs. The most recent release dates from 14 November 2019.
NHS Digital gives some headline stats that often get picked up in the media. For example, in 2017/18 the cost at list price of medicines was £18.9 billion. Not only that, but NHS Digital gives the rate of change over time, both for hospitals (11.1% increase on 2016/17) and primary care (fall of 2.8%) and overall (4.1% increase).
Official data gets used widely, not all of which include caveats on the data
By 15 November the Pharmaceutical Journal had put out their piece, with the 4% overall rise in their headline.
NHS Digital puts emphasis on the fact that the cost is not necessarily the price that the NHS paid. It’s right there on their key facts and repeated. This is picked up too by the Pharmaceutical Journal.
Unsurprisingly NHS England – the biggest buyer of medicines for the NHS – makes reference to NHS Digital data when it talks about spending on medicines. As just one example, a news piece from November 2018 highlighted the potential for a £300 million saving on NHS drug spend through use of biosimilar versions of adalimumab.
To place the £300 million in context, NHS England points to the headline cost of medicines in England of £18.2billion in 2016/17, as well as noting that this was “an increase of more than one third since 2010/11”.
NHS Digital data is referenced too by the Health Foundation – an independent charity focusing on improving health and health care for people in the UK – who have a ‘Chart of the month’.
Back in March 2017 the chart was the cost of drugs for the NHS in England by sector, from 2010/11 to 2015/16. The chart was accompanied by discussion – focusing on increasing growth in spend – none of which mentioned the issue that list prices don’t reflect what the NHS really pays.
Organisations like Global Justice Now – a self-described democratic social justice organisation that works globally – use NHS Digital data too as part of their campaigning. For example, a February 2019 news piece focused on what the NHS spends on cancer drugs developed with public funding. The piece cites £18.2 billion being spent on medicines in 2017/18, an increase of 28% since 2010. It does not, however, mention the caveats that NHS Digital highlights.
The need to take into account payments under national deals covering medicines spend
The King’s Fund – an English health charity seeking to influence policy – uses NHS Digital data too when looking at spend.
For example, a piece from King’s Fund senior fellow Nicholas Timmins back in February 2017 made reference to medicines spend, including how the pharmaceutical bill had been rising faster than the overall increase in NHS expenditure.
In this piece Timmins rightly puts caveats both on the discussion in the piece, and NHS Digital stats, by noting that they don’t include rebates due under the 2014 Pharmaceutical Price Regulation Scheme (PPRS), payments that NHS Digital doesn’t name-check.
The 2014 PPRS was a voluntary deal struck between the UK government and the Association of the British Pharmaceutical Industry (ABPI) which set a target growth rate for NHS spend on branded medicines. Member companies made payments to ensure that the growth rate was not exceeded. Yet the piece asserts incorrectly that the scale of these rebates was not in the public domain. Payments made under the scheme were published in the PPRS quarterly net sales and payment information collection.
Payments under the 2014 PPRS, which ended in December 2018, ranged from just over £300million a year to over £800 million using figures from the Department of Health & Social Care over the years (figure 1).
Figure 1: PPRS payments, 2014 to 2018
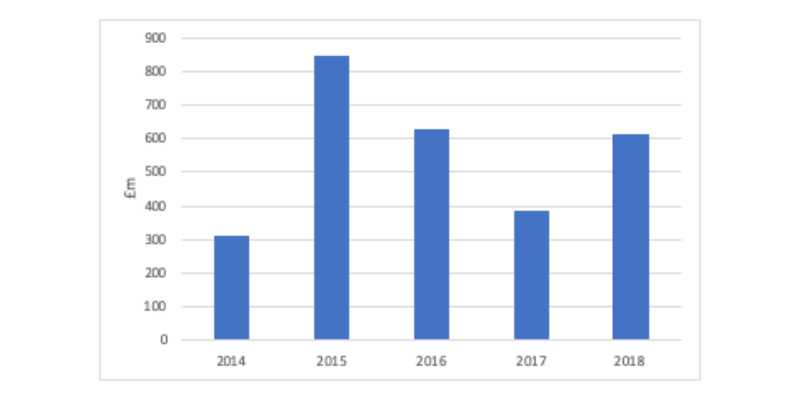
Source: Data from DHSC, published April 2019.
PPRS payments – and now payments under the successor to the PPRS, the 2019 Voluntary Scheme for Branded Medicines Pricing and Access (VPAS) – are the way that the NHS across the whole of the UK has limited growth rates in national spending on around 80% of the value of the branded medicines market.
The 2019 VPAS – which runs to 2023 – has agreed a growth rate of 2%. A range was agreed in the 2014 PPRS, from 0 per cent to 1.9 per cent.
Companies not in the VPAS make payments too, as part of the statutory scheme for branded medicines. Generic spending is shaped primarily by competition.
What the VPAS means, and the 2014 PPRS before it, is that the real growth rate in what is spent on branded medicines in the UK is not the same as headline figures on cost of medicines from NHS Digital suggest.
Whilst technically inappropriate it’s useful just to plot the growth rates to help see the difference. It’s inappropriate because it’s not an apples to apples comparison; the VPAS and PPRS growth rates are on a different base – changing even between schemes – as well as being a comparison of capped growth at the UK level on branded medicines in calendar years to the cost of all medicines but for England only, and on financial years.
The differences would be even more stark if growth rates were plotted according to hospital versus primary spend, with hospital spend seeing double headline digit growth in recent years.
Figure 2: Comparison of growth in the national cost of medicines
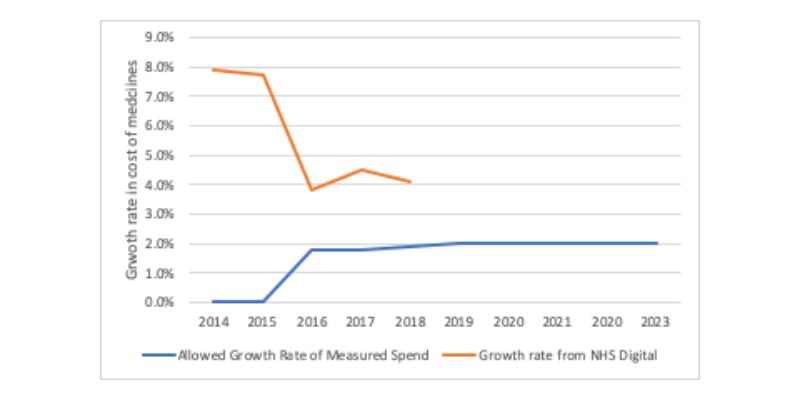
Note: The allowed growth rate of measured spend is from the 2014 PPRS and 2019 VPAS which are based on branded medicines only and the base changed between the schemes and on a calendar basis. Growth rate from NHS Digital is for medicines in England on a financial year basis.
True spend needs more than adjustments for national deals
Of course, even taking into account VPAS payments still reveal what the true spend is because of various discounts in the supply chain.
They range from framework contracts to discounts offered in order to secure positive recommendations from the HTA body, the National Institute of Health and Care Excellence (NICE).
The latter are known as Patient Access Schemes (PAS), and the vast majority of these are simple discounts rather than more complex deals where outcomes can trigger financial consequences.
Simple steps to increase awareness of VPAS
The solution to helping all stakeholders get to grips with the real spend on medicines in the UK is not straightforward; even getting recognition of VPAS payments involves a number of agencies working together.
It might be best to start simple; providing web links to the routine reporting that the Department of Health and Social Care provides on VPAS in NHS Digital publications with a short explanation could be an easy win in England, especially if the Department publishes a breakdown of what VPAS monies go to each nation across the UK.
Doing this would also give a heads up to the media, think tanks and others so that they can be signposted too, raising awareness of the VPAS and its role in medicines spending.
Getting to grips with the real spend is a far bigger agenda. It is one that is being tackled. NHS Digital is looking into new data sources so that it can report actual cost paid by the NHS by medicines. More detail – including a comparison across data sources on actual cost – is expected to come out in spring 2020.
The reason it matters to get a sound understanding of medicines spend in the UK is to ensure that the starting point for stakeholder debate and policy development is starting from the same point.
It’s perhaps no surprise that the presence of VPAS is the focus of the Association of the British Pharmaceutical Industry’s communications; for example, the ABPI tweets that NHS spend on new medicines is under control because of an agreement between pharma and government. Such work needs to continue.
It’s perhaps no surprise too that there is little NHS recognition of VPAS; it plays well into their affordability agenda to focus on the double digit growth after all.
About the author
 Leela Barham is a researcher and writer on health and pharmaceuticals, from a health and policy perspective. Leela has worked with all stakeholders across the health care system, both in the UK and internationally, working on the economics of the pharmaceutical industry. Leela worked as an advisor to the Department of Health and Social Care on the 2019 Voluntary Scheme for Branded Medicines Pricing and Access (VPAS).