Resourcing HTA across Europe

With the European Commission looking to formally strengthen health technology assessment (HTA) across Member States, Leela Barham attempts to assess and benchmark the resources currently directed at it from a wealth of documentation.
In February 2018 the European Commission (EC) set out plans to ‘reinforce cooperation amongst Member States’ on health technology assessment (HTA) using a new regulation on HTA. The ambition is that, by working together, Member States can benefit from patient access to innovative health technologies, make better use of available resources, and improve business predictability. But what resources are put into HTA in Europe today?
Mapping HTA processes – a focus on resources
The EC has commissioned a host of work that has informed its decision to put cooperation on HTA on a formal footing; for those who missed it, or just couldn’t face the hundreds (and what feels like thousands) of pages on the topic, one of the highlights is the major undertaking to map the HTA processes used in Member States (MS) and Norway today.
While this is not the first time that the costs of HTA have been looked at, it’s the first time (that I know of) that systematically examines costs for each HTA agency in each MS (where the data are available).
Staffing of HTA agencies
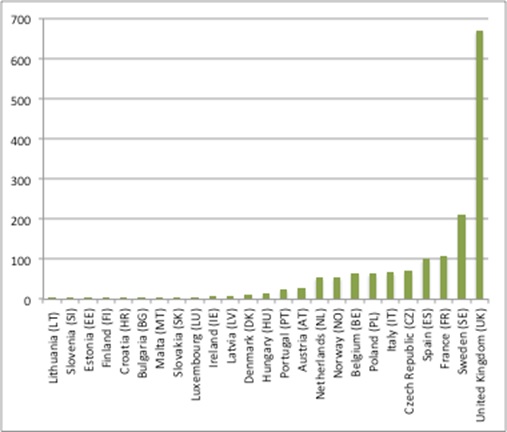
The mapping work illustrates a marked variation in staffing for HTA by country (where the numbers of staff for what can be multiple HTA agencies within the country have been added together) from just 1 Full Time Equivalent (FTE) to 670 FTE (figure 1).
Figure 1: Number of FTEs doing HTA in Member States, 2017
Source: Analysis of data from Chamova, J (2017) Mapping of HTA national organisations, programmes and processes in EU and Norway Annexes
Perhaps unsurprisingly the UK has the most FTEs, reflecting not only the work of the National Institute for Health and Care Excellence (NICE), but other HTA agencies too. Some caution is needed, though; the numbers for NICE are in broad agreement with NICE’s annual report for staffing. This means that, despite denoting staff that do HTA, it is essentially reporting every member of staff, not just those doing the HTA. Plus NICE does a great deal more than HTA, which could mean that the comparison across countries is not an ‘apples-to-apples’ comparison if, for other agencies, just HTA staff are counted.
Worth noting, too, is that some agencies’ data weren’t available, so the total staff of 1,595 FTEs across Europe is an underestimate. With data not available on 11 HTA agencies, it could be a big undercount too.
Budget of HTA agencies
It’s not just the people who are necessary for HTA, but also additional resources to cover a host of overheads and even the cost of bringing in external report.
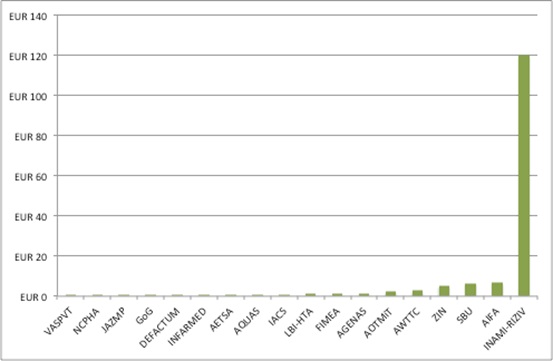
As with staffing numbers, there is variation in budgets for HTA (and, again, missing information too). The Netherlands tops the chart, with EUR 120 million for INAMI-RIZIV, while Lithuania’s VASPVT sits at the bottom, on EUR 30,758 (Figure 2).
Figure 2: Budget for selected HTA agencies in Europe, 2017, EUR m
Source: Analysis of data from Chamova, J (2017) Mapping of HTA national organisations, programmes and processes in EU and Norway Annexes
Again, caution is needed when reviewing the numbers. According to the same report Slovenia’s VASPVT has undertaken some 340 HTAs, taking 150 days for each one. How this is possible with just over EUR 30,000 a year is a question worth considering. Is it a typo, a misunderstanding of the data being requested by the study author, or something else? It also contrasts with 2013 estimates that it costs an agency EUR 80,000 to EUR 120,000 for a full HTA, and EUR 30,000 for a rapid HTA.
It is not worth totalling up the budget numbers because data isn’t available for 36 HTA agencies, including big hitters like NICE. Whatever the real spend on doing HTA across Europe, it’s got to be substantial.
Need to take the wider perspective
Naturally, the work tends to look at the costs from the Government’s perspective, counting the cost for running HTA agencies. The costs for industry and others need to be considered and duplication from their interactions with several HTA agencies stripped out if the ambition of making better use of resources is for all stakeholders.
The costs to industry from an HTA are high – estimated to be between EUR 73,000 and EUR 1.7 million, with additional evidence generation for each country HTA agencies of EUR 50,000 to EUR 20 million. As with the mapping work, caution is required as these numbers are based on just 20 industry stakeholders’ participation in a survey. (I’ve never seen costs for others, such as patient groups, clinician organisations and others input in HTA, but their time has a cost too).
The idea that streamlining HTA could also streamline its costs is appealing to industry. That needs to be delivered not only by genuine sharing by HTA agencies – as well as mutual respect of the findings of others – as part of the cooperation that the EC envisions, but also by not shifting costs on to companies; such as getting them to do (even more) adaptation for the national, regional or local context of what amounts to an international relative effectiveness assessment (REA).
The future: genuine savings?
Before the full implementation of the EC’s plans is the opportunity to benchmark the current situation. The mapping of HTA process is not enough, by itself, to know the resources used for HTA now. Nor should that be seen as a criticism of the work; HTA is so diverse and even getting as good a picture as the mapping does is a significant achievement. It also highlights just how far Europe has to go to harmonise even the REA of technologies.
Even without a full understanding of the current resourcing of HTA, it is plausible that there is duplication. That said, it’s hard to know how much could be freed up under the EC’s plans in reality. That depends on major changes in how things are done across Europe.
Estimates from the impact assessment suggest confidence that duplication will be tackled, with estimated net savings of over EUR 2 million for countries. The impact assessment also notes that there may be more savings as spillovers from efficient healthcare investments, but these can’t be quantified.
It is worth noting that these estimates seem to be somewhat divorced from the reality of resources used (unless I missed the link in the 158 pages of the impact assessment, the 254 pages of the report underpinning the impact assessment, its 141-page Annex, the 51 pages for the mapping and its 80-page Annex).
For industry, the cost savings are estimated to be even greater: EUR 64 million. At the same time the savings are considered minor because the overall cost of bringing a drug to market is so high. More important is the potential for faster access and the boost to the bottom line that this could generate. Even speeding up access by one month is estimated to be worth EUR 130 million. However, there is a question over whether this can be sustained in the light of competition.
Whatever is actually freed up needs to be at least as much as the costs of running a formal cooperation on HTA across Europe for it to make economic sense. The EC’s impact assessment estimates this at a minimum of EUR 8 million a year in running costs, EUR 9 million a year for joint outputs, plus some in-kind contributions from HTA agencies. On the face of it, that’s not an unreasonable target.
About the author:
Leela Barham is an independent health economist and policy expert who has worked with all stakeholders across the health care system, both in the UK and internationally. Leela works on a variety of issues: from the health and wellbeing of NHS staff to pricing and reimbursement of medicines and policies such as the Cancer Drugs Fund and Patient Access Schemes.
Note: Since 5 March 2018 Leela has become a subject matter expert on medicines pricing policy development for a Government client. For the duration of her involvement in that project she will be restricted on the topics she can cover.
Find out more here and contact Leela on leels@btinternet.com


