The PPRS medicines pricing scheme: is it working for both sides?
The PPRS is the keystone of the UK’s medicines pricing system, but is the agreement launched in 2014 working for the pharma industry and the government?
The Pharmaceutical Price Regulation Scheme (PPRS) is the UK government’s pricing agreement on branded medicines with the pharmaceutical industry, and has been around in one form or another for more than 50 years.
However there were some significant changes when the new PPRS agreement was launched on 1 January 2014, most notably a new mechanism to cap the growth of NHS medicines spending in each year of the agreement.
The deal was struck at the height of the UK government’s austerity measures, and the planned ‘allowed growth rate’ in medicines spending reflected a squeeze on NHS budgets.
There was no permitted growth in the branded medicines bill in 2014 and 2015, with growth then allowed to begin in 2016, 2017 and 2018, but limited to 1.8%, 1.8% and 1.9%, respectively.
Moreover, if and when expenditure exceeds these agreed level, PPRS members as a whole have to make repayments – PPRS payments - back to the government.
These payments replaced the old system of headline price cuts of previous schemes, and the industry has to date paid back over £1 billion to the government (figure 1).
The Association of the British Pharmaceutical Industry (ABPI) agreed to this deal with the Department of Health (DH), in return the 2014 PPRS included key commitments on patient access– a long running concern of industry.
As we approach the end of 2016, the deal has reached it half way point, with the agreement to complete its 5 year lifespan on 31 December 2018.
So what trends and conclusions can be drawn from the agreement so far?
Analysis of the PPRS needs to look widely – as widely as the agreement itself – but one of the clearest guides can be found in the quarterly reports of the PPRS payments. The latest data was published in September, making it possible to take a look at PPRS payments at the half-way point in the scheme.
Figure 1: Quarterly and cumulative PPRS payments, Q1 2014 to Q2 2016, (£m)
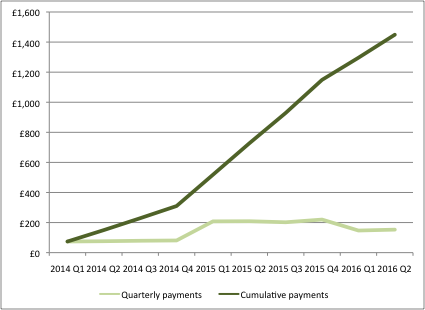
Source: Data from DH
Unpredictable growth
In agreeing the deal in late 2013, neither the Department of Health nor the ABPI could be sure whether actual growth in medicines spending would exceed the annual growth caps or not.
Expectations on both sides were informed by forecasts made at the outset of the 2014 PPRS. For example, the DH and ABPI published a Heads of Agreement in December 2013 that included forecasts for the growth rate in measured spend (the 2014 PPRS has some exclusions, so measured spend is not the same as the total spend on branded medicines), the share of new products in that measured spend, as well as the expected annual payment percentages.
Growth in measured spend has been much more variable than expected – whilst it was far higher than forecast in 2014 (6% rather than just under 4%), the following year it was far lower, under 1% compared to the predicted 3.5% (figure 2).
Figure 2: Forecasted growth rate of measured spend, 2013 and 2015
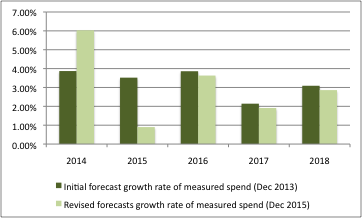
Source: Data from DH and ABPI and DH
In turn, payment percentages have been adjusted too, with a higher payment percentage in 2015 than expected in 2013, and now lower in the final years of the scheme (figure 3).
Figure 3: Annual payment percentages as expected in 2013 and 2015
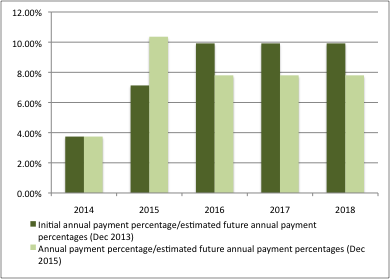
Source: DH and ABPI, DH
The situation may have changed since the revised forecasts in December 2015 as well. According to formal review minutes of a meeting between the ABPI and the DH in March 2016, “growth was now significantly below the original project profile for this stage in the scheme.”
Where do the PPRS payment go?
While companies have to make quarterly payments to the DH, the PPRS agreement doesn’t say where they go from there. In practice, the DH has agreed a split of PPRS monies across devolved nations. The DH has allocated PPRS payments into the overall allocation to NHS England (NHSE).
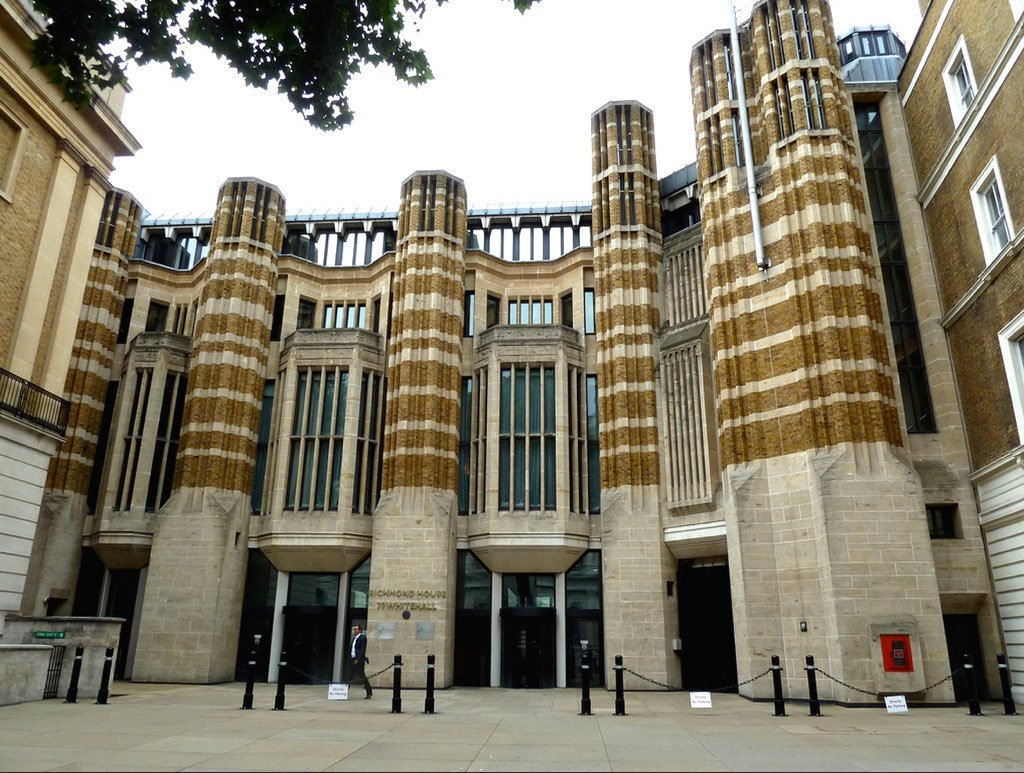
[caption id="attachment_16742" align="alignnone" width="238"] The Department of Health[/caption]
NHSE then makes its own decisions about how much to allocate to itself for the services that they commission and pay for (such as specialised services for relatively rare and complex healthcare, including drugs used as part of those services) and how much to allocate further out to the Clinical Commissioning Groups (CCGs).
Advance PPRS payments factored into allocations to the NHS
The DH took the decision to allocate estimated PPRS receipts in advance to NHSE. This has created a novel problem where the DH has actually overpaid NHSE, as PPRS payments have been less than anticipated (figure 4).
The ‘shortfall’ is driven in large part by parallel imports and divestments to the Statutory Scheme (the default for those companies who choose not to join the voluntary PPRS). The DH has said that sales of £157m have moved out of the PPRS and into the Statutory Scheme. It’s also driven by the agreement struck to limit the amount paid back on products in the Cancer Drugs Fund (CDF).
Figure 4: Expected and actual PPRS payments, 2014/15 to 2015/16 (£m)
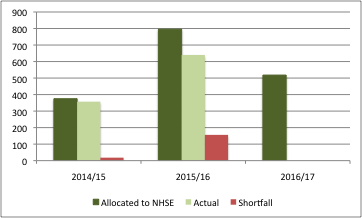
Source: Data from DH
The shortfall in PPRS payments was made up by the Treasury in 2015/16.
It remains unclear whether the PPRS payments will hit the DH’s forecast of £647m for 2016/17. If not, this could see a repeat of the problem from the previous financial year, as an allocation of £518m has already been made to NHSE.
The future?
Time will tell how the PPRS will evolve after December 2018. The successor to the 2014 PPRS could revert to headline price cuts. There’s something appealing about keeping it simple: it would certainly demystify the PPRS, which has become more complex over time. There should be a lot of sympathy for those who struggle to reconcile the PPRS with other headlines on spend on medicines.
For example, NHS Digital’s prescribing costs in hospitals and the community in England 2014/15 illustrates a 7.8% increase on spend versus 2013/14. This is not an apple to apple comparison: a financial year, just for England and including generics versus the calendar year, UK wide and for growth in measured spend on branded medicines. Even despite this, the difference between around 8% growth and the revised growth in measured spend of around 1% raises questions about what is really happening in the medicines market.
Those questions intensify in light of what different sources seem to suggest. For example, ABPI analysis discussed with the DH in March 2016, highlights that IMS data shows 7.8% growth from 2014 to 2015 at list prices for branded medicines sold by members of the PPRS. PPRS measured spend reported by companies suggests a decline of 0.2% for the same time period. Even parallel imports and other exclusions can’t explain all of the gap between the IMS data and measured spend. Discounting could be it: the DH seem unconvinced, though, about the real gains from discounting, suggesting that it hadn’t led to a saving in the drugs bill.
At the same time, many individual pharmaceutical companies have expressed unhappiness with the agreement, saying the promise of greater uptake in new medicines has not materialised.
If PPRS payments continue, the DH may decide to be more cautious. They could pass on payments once the sums have been added up for example. That may be financially prudent – avoiding the need to go cap in hand to the Treasury – but it would add (even less) credibility to the idea that underwriting the NHS spend on medicines could improve access to medicines.