Operational forecasting – making your numbers stand up

James MacDonald
Emerald Idea
An operational forecast can never be simply compared to a weather forecast, whose purpose is to arrive at the best scientific prediction of future events. The difference of course is that we are engaged in forecasting for business objectives, so our task is not just to foresee the future but also to make it happen. Here we take a brief look at some of the challenges involved and possible solutions.
Operational forecasting quality can be quite variable across different operating companies, and improving this capability is one of the most rewarding activities in strategic consulting, because its results are so tangible and its legacy so clear.
If you are a marketer or a business strategist you will know the satisfaction of having numbers that stand up, and you probably also know the frustration when they don’t.
The first question is what kind of forecasting are we actually engaged in?
• Evaluation / Valuation – what is the opportunity and what is its value?
• Strategic - what is the market and business outlook over the strategic period?
• Budgeting - what can we deliver next year?
• Production - how much product do we need to manufacture?
My focus here is on strategic and budgeting forecasting: a critical operational task on a year-to-year basis. These two processes are usually linked with a short-term forecast covering the current (latest estimate) and next (budget) year in detail, and a medium-to-long term (5-10 years) outlook.
 ,
"If you are a marketer or a business strategist you will know the satisfaction of having numbers that stand up…"
 ,
I want to take a look at just two areas and their challenges: the use of models and the quality of forecasting thinking.
1. Use of models
You have just been sent a new uptake model for your forthcoming launch product – what do you do next?
Getting inside the model is probably the first priority, and means taking the time to study with care how the model is actually built. This may be time-consuming, but the result is that you understand what is driving the numbers and the thinking behind them.
Constructive dialogue with the owner / author is a necessary part of the process. In addition to the usual discussion around key assumptions (typically epidemiology, uptake curves, competing sources, and so on), it cannot always be assumed that the model itself is correctly built. The golden rule is to test out every parameter available to you.
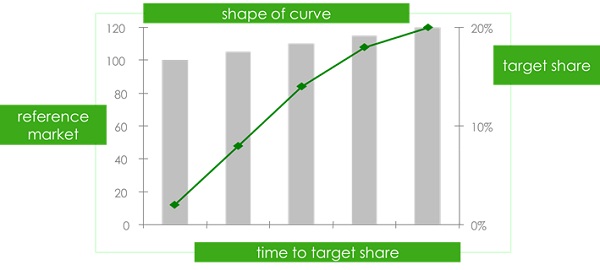
Finally, models come in many shapes and sizes and degrees of complexity. It is always good to stand back and focus on the “big four” parameters driving any forecast (see figure 1). By taking these one by one, you will improve the quality of your thinking and reduce the risk of errors of confusion.
• Reference market - typically epidemiology / patient based or historical, and always subject to the impact of future events the marketer will have identified.
• Target share (or peak share in the case of a lifecycle forecast) - defined by a blend of product profile, product labelling and competitor strength and numbers. It is further affected by intention to prescribe.
• Time to target share - often considered difficult, in fact it can be reasonably estimated from the size of the dynamic opportunity over time, and therefore the minimum time over which a given share increase could be achieved.
• Shape of the curve - tells us how fast the progress is to target share, and should be addressed in its own right. Factors will include dynamic market share, preference share, intention to prescribe and reach.
2. Quality of thinking
You are uncertain about the robustness of a key assumption regarding dynamic market share – how can you test it in the short time available?
There is a general arithmetical relationship between average dynamic market size and average length of treatment (see figure 2). This can be very useful when trying to model how quickly an impact on the dynamic market can affect sales.
Market shares always add up to 100%. While this is obvious, it is surprising how often we are tempted to think about our own (dynamic) market share without focusing on the rest of the market!
Another common challenge is understanding how first, second and third line positioning will affect uptake. One key insight here, again obvious but sometimes overlooked, is that a greater share of, say, first line opportunities reduces your second line opportunity – by definition! Equally, a low or absent first line share is never welcome, but it does open up all the second line opportunities.
The most useful and easiest technique I know is to visualise your numbers graphically. In figure 3a we see a four-year forecast by month, and there is no better way of sanity checking share expectation than to see the curve. We have all been guilty of rushing off annual shares, only to find they are unrealistic, because we have not accounted for entry and exit shares over the year.
 ,
"…a greater share of, say, first line opportunities reduces your second line opportunity – by definition!"
 ,
Figure 3b shows how a high-level visualisation of a total reference market can help us reflect on whether we truly believe this is what will likely happen.
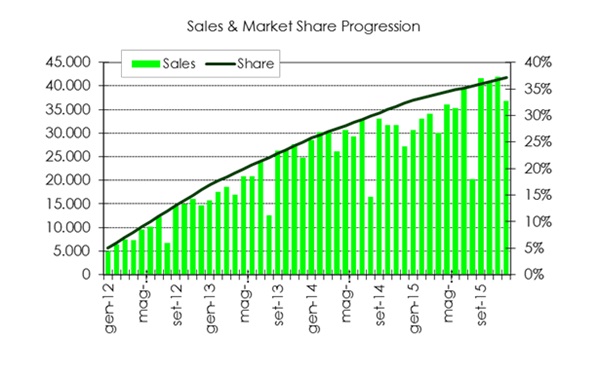 Figure 3a: Visualising share progression
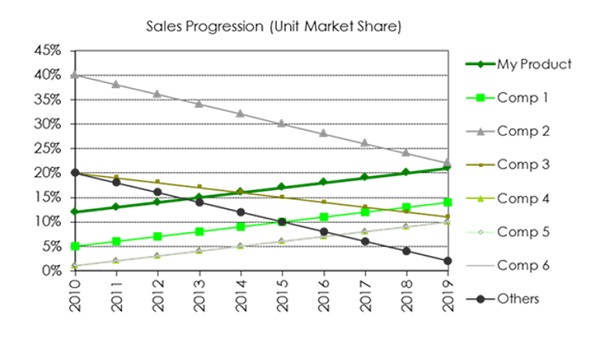 Figure 3b: Visualising share progression
Now, suppose you are wondering where your market share gains will come from within the reference market – how can you make an intelligent judgement?
One way to address this challenge is to approach the market forecast in a top-down order. For example, by building your market first by class, then molecule, then brand, then presentation, etc., you will focus your attention on the macro trends first and on secondary ones later. While not always perfect, this often works better than starting at the brand level.
If you are going to be impacted by some major events like loss of exclusivity, how will you integrate them into your forecast?
Best and worst cases are usually used, but how often do we create “true” best/worst scenarios? True best means literally achieving every dynamic share opportunity in the market, and true worst is achieving none. This never really represents reality, but it frames the entire range of the possible, and that range can sometimes be surprisingly narrow!
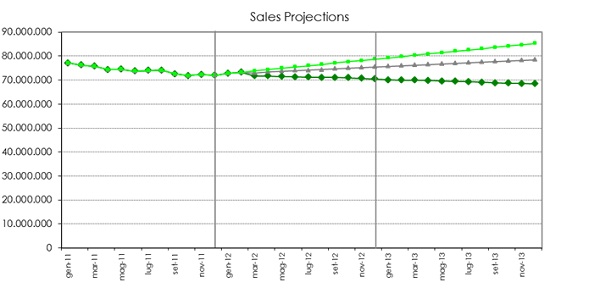
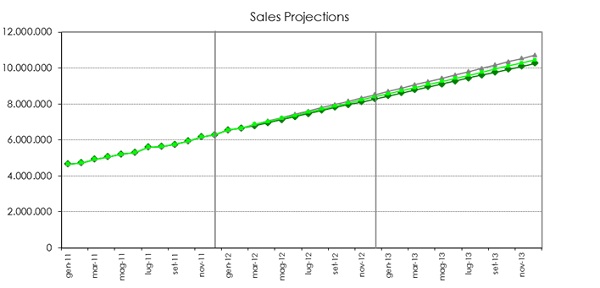
Projection, typically linear, is useful in mature markets with rich historical data, and again while not representing reality, over the short term (no more than 2 years) it frames current trends and also highlights whether they are stable or variable, as shown in figures 4a (variable) and 4b (stable).
 ,
"If you are going to be impacted by some major events like loss of exclusivity, how will you integrate them into your forecast?"
 ,
Benchmarking is a third and very useful method, provided you have comparability between the case used and the current scenario.
I expect we have all experienced management changes versus our market forecast – how can we adapt while keeping our forecast realistic?
It’s important to realise that, once we reach this stage, we are engaged in a business discussion, not a technical forecasting one. But even if we know the final numbers may be beyond our control, it’s a good idea to translate new changes into meaningful market scenarios. Top management don’t like to hear “that’s not possible”, but they will usually appreciate insights like “this will entail doubling our monthly patient uptake for the first six months”, or “that means our reach will have to go from 80% to at least 95%”.
Finally, if I had to choose my top few pointers, they would be:
1. Focus on the big four – market size, target share, time to target, shape of the curve.
2. Visualise your key numbers and transitions graphically.
3. Identify and model your key drivers (dynamic market, new patients, market growth, generic penetration, etc).
4. Create “true” best and worst cases as reference points.
5. Adapt and iterate as much as possible and know what a new number will entail in your scenario.
 ,
 ,
About the author:
James MacDonald is the owner and Managing Director at Emerald Idea, a strategic consultancy he founded in 2009 after holding leadership roles in sales, marketing and business intelligence in the UK, internationally and in Italy with companies including Schering-Plough, Takeda, Organon, Ferring and Roche.
What are the key aspects of an accurate operational forecast?

