Web and mobile technologies for health economics modelling

Digital apps are more agile than longstanding solutions and enable wider uptake among the less technical population and tailored interrogation of data, says Oleksandr Topachevskyi.
Mathematics and statistics software packages MS Excel, SAS, SPSS, R, Stata, Matlab and others are well-known tools for modelling epidemiological and economic models. They have been around for over 30 years and earned good reputations among modellers. But how good are they for everyday users and for communicating outcomes?
Academics, researchers and others no longer need to use somebody else’s modelling work to generate country/hospital-specific estimates based on local data.
The visual and functional capabilities of web services and mobile apps have evolved rapidly over the past five years. Information and data are migrating to cloud environments, breaking out of standalone software packages and local hard drives. Modern software solutions nest within one another; they are interconnected and exchange data with external services, like calculation engines, data streaming and publishing. Just 20 years ago it would have seemed futuristic, but today anybody can become a modeller and modify complex epidemiological, economic and disease data using a model calculation core via a dedicated public or private web service and a simple, intuitive and user-friendly web interface. Thus, more employees with less training can run outcomes simulations and ‘what-if’ scenarios examining the clinical and economic outcomes of the adoption of new healthcare technologies.
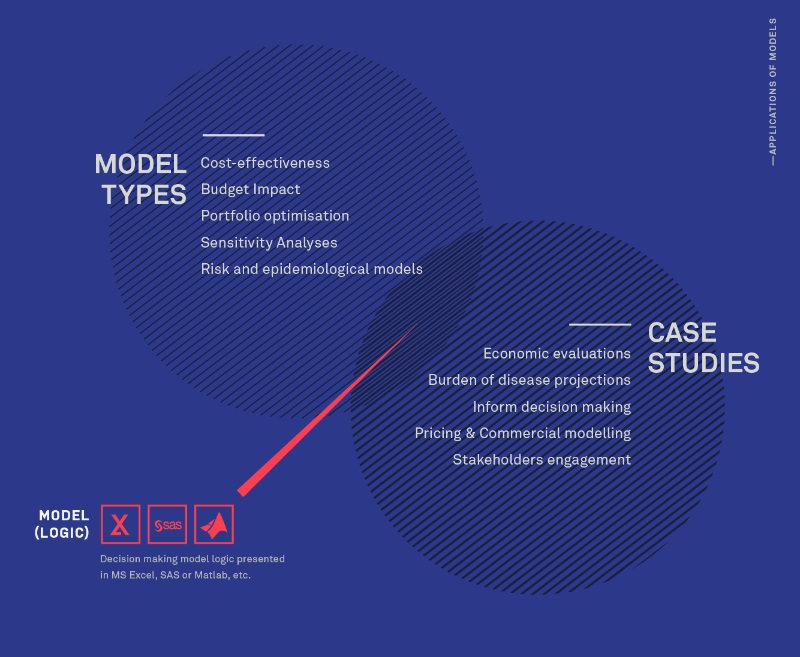
Figure 1. Models used for projections of clinical and economic outcomes.
What’s wrong with Excel models?
The main driver of health economics models to the web environment was that MS Excel, despite being one of the most popular software packages for modelling, was not comprehensive enough to meet the wide spectrum of communication and data presentation requirements in market access and health economics and outcomes research (HEOR).
Excel limitations:
- Not the right tool for communication. Excel has never been a tool for creating impactful presentations and communications, and it was never designed for storytelling. Its presentation capabilities are limited by the user interface customisation possibilities required to develop specific story flow, events, useful animations/transitions, and other user experience features. VBA can handle part of the job, but will it run on all computers, operating systems and mobile devices?
- Limited integration with other services. Despite Microsoft’s efforts in the cloud space (Office 365), Excel still has a limited integration capabilities with external services and export/import/sharing barriers.
- Dependence on software availability and settings. Obviously, one needs to have Excel installed, and often VBA enabled, to open and run the model. It can be difficult to know whether end users have managed to run the model on their own computers and enabled VBA in a developer tab.
- Long running time. It may take several days to run probabilistic sensitivity analyses (Monte-Carlo) in a complex Excel model. Such a long run time makes it infeasible to explore parametric uncertainty or quickly modify charts for publication purposes.
- Too technical and hard to understand. Excel models have always required some basic technical knowledge to operate them and can be complex to understand without the proper background and training.
What do digital apps do better?
eModels, or interactive economic models, enable budget impact, cost-effectiveness, optimisation, and so on, to be delivered as a rich web/mobile app. They resolve the MS Excel limitations listed (poor presentation, limited integration and sharing, speed and dependence on standalone software) and achieve a different, more engaging, user experience.
eModels have the spirit of an app, with dedicated interfaces and behaviour designed to assist the user and make the modelling and results communication journey as easy and clear as possible.
Interactive models were mainly developed in Flash between 2000-2010. Later they migrated to HTML5/JS browser or native mobile environments employing powerful charting libraries, parallel computing server capacities for fast calculations (decreasing sensitivity analyses runtimes by up to 10 times), database integrations, other external services and Application Programming Interfaces (API).
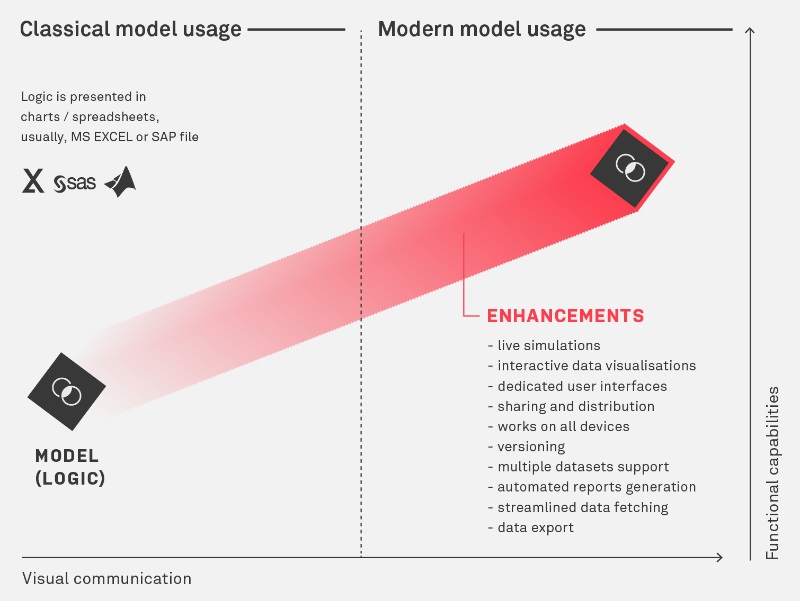 Figure 2. Features of modern mathematical models
Benefits of migration to web/mobile environments.
Visual communication:
- Better content perception because of information architecture design and data visualisation best practices. Interactive data visualisations enable users to explore the relationships between various data points.
- Unified story flow environment. Model navigation allows logical communication of the economic value story.
- Powerful interfaces support multiple storytelling modes (elevator, linear, open-world,) for different internal roles and external communications.
- Custom modes. The ‘play data’ mode, for example, animates drug spend data in chronological order, enabling the user to explore the evolution of key input parameters via interconnected live charts.
Functional capabilities:
- Accessible on multiple devices. (PC/mobile), operating systems (Win, MacOS, iOS, Android, WinMobile) or browsers owing to web cross-platform nature.
- Always up to date. Using API, the model automatically fetches input data from external databases or public data resources.
- Expandable. High nesting capabilities and API enable easy integration with external services and a company’s IT infrastructure.
- Data sharing. Data sets and simulations are stored in the cloud, making evidence available for different user groups and target audiences.
- Fast and responsive. Modern web browser engines supported by powerful server capacities guarantee outstanding model calculation speed and responsiveness of user interface.
Most popular eModel formats
- Web app. This runs in a browser environment, such as Google or Safari, and is the most popular option, being fast to develop and easy to distribute. Web apps have excellent performance and can work even if the computer is offline, although probably with some loss of functionality.
- Native OS app. Native apps take full advantage of the original device’s operating system and are more responsive and offer better performance, compared to web apps, usually. In addition, they have access to OS services (e.g. camera, microphone or e-mail client), but are limited to execution in the OS for which they were developed. The biggest restriction of native apps for mobile devices is the need to establish a dedicated distribution channel, such as an internal corporate app store (like Apple Appstore or Android Google Play) to share the app with staff.
- Hybrid app. This is a lightweight, standalone native app created on the code basis of a web app. Web apps are often converted to hybrid apps to migrate the model to mobile devices and achieve full offline capabilities.
eModels in use
eModels can benefit many working in the health economics and disease modelling domains, including industry, payers, academia and consultants.
Benefits for global health economists:
- Easy-to-use, engaging tools for regional and local needs
- Complete overview of model adoption globally, usage statistics
- Instant availability of country-specific datasets for multi-country health economics papers and posters
- Availability of insights from the field with automated analytics and closed-loop marketing (CLM) modules
- Integration with in-house client relationship management (CRM)
Benefits for regional/local health economists, key account managers and scientific outcomes liaisons:
- Powerful decision-making and payer engagement tools, delivering economic value story in an effective, concise and impactful digital manner
- Interactive data visualisations conveying the meaning of data and modelled outcomes in an easy-to-understand way
- Real-time modification of model input data to reflect a specific payer setting, enabling effective two-way dialogue with the payer
- Easy, streamlined access to the model from multiple devices
- Automated generation of business case summary reports.
Conclusion
Using eModels greatly improves user experience, especially for non-experts, personalises results for specific audiences and user groups, enables the ‘slice and dice’ of resulting data to understand details and underlying assumptions, as well as gathering external audience perceptions for further analyses and ongoing improvement of the economic value story.
eModels are easy to understand as their design includes many functional and visual improvements, making them the best tool for pharma and medical device companies to employ to engage and communicate with payers and decision makers on a global scale.
About the author:
Oleksandr Topachevskyi is a founder of Digital Health Outcomes. He works at the intersection of health economics, modelling, statistics, data visualisations, software development, design and UI/UX and develops apps/tools that communicate health data and economic models.
He has over 10 years’ experience in economic evaluations of health interventions and company/assets valuations.