Has the UK been best place in the world to invest in life sciences?
How has the UK compared to its European peers in terms of supporting growth and innovation in the pharmaceutical sector? And with a renegotiation of the PPRS pricing deal imminent, Leela Barham casts an eye over the data.
The current pricing deal between the UK pharmaceutical industry and Government, the Pharmaceutical Price Regulation Scheme (PPRS) has among its goals the supporting of growth and innovation within the sector.
As this agreement is due to end in December 2018 and a new scheme will be negotiated, there’s an opportunity to look back and see how the UK has fared on indicators for growth and innovation.
Available indicators
There are different choices and sources to select indicators that can give an insight into the UK as a location for investment and growth generated for the UK economy. These come both from industry – for example the European Federation of Pharmaceutical Industry Associations (EFPIA) – as well as Government – for example the Office for Life Sciences (OLS) Competitiveness Indicators and Biosciences and health technology database.
Just a few of the possible indicators that could be looked at are covered here. Where possible these look back to 2009; the last PPRS before the current one came in in 2014 to give some sense of a trend. Most indicators have quite a lag; so each indicator goes up to the most recent data available which is often, but not always, 2015. Of course given the global nature of the industry, you can also look at data further afield from Europe but a European perspective is taken here.
Indicators on the up….
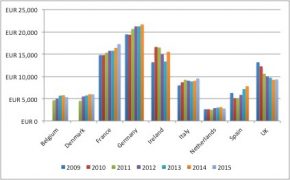
For R&D spend, the UK has seen some variation over time, but with the most recent data has seen an increase in R&D expenditure. On this indicator, the UK is more on a par with Germany and far ahead of other European countries (Figure 1).
Figure 1: Pharmaceutical R&D spend, selected European countries, 2009-2015, EUR millions
Source: Data from OLS annual life sciences competitiveness indicators
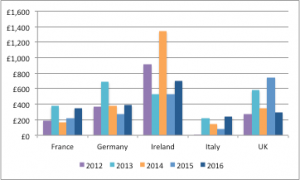
The UK has seen an increase too on the number of life science foreign direct investment projects (Figure 2). The UK has bucked the trend seen in two other key markets; both France and Germany saw a fall. However some caution is needed; this is just the number of projects and value, naturally, matters. That paints a less convincing picture for the strength of the UK (Figure 3).
Figure 2: Number of foreign direct investment projects, selected European countries, 2012 to 2016
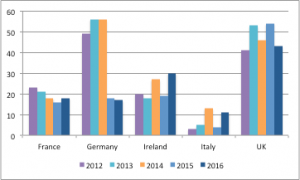
Source: Data from OLS annual life sciences competitiveness indicators
Figure 3: Capital investment from direct investment projects, selected European countries, 2012 to 2016
Source: Data from OLS annual life sciences competitiveness indicators
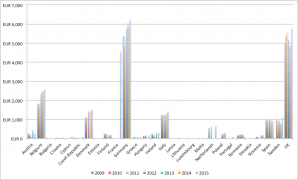
The UK has though seen an increase in the value of private equity investment, but still lags behind Germany (Figure 4).
Figure 4: Private equity investment, selected European countries, 2010 to 2015
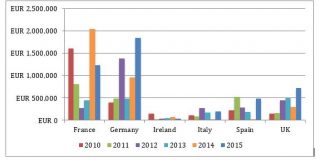
Source: Data from OLS annual life sciences competitiveness indicators
The UK tops the chart though for selected European countries when it comes to Government spend on R&D, and has seen an increase in investment over time as well (Figure 5).
Figure 5: Government spend on health research and development, selected European countries, 2010 to 2016 US$ billion
![]()
Source: Data from OLS annual life sciences competitiveness indicators
…and going down
The UK has not fared well on a number of key indicators.
Employment in the pharmaceutical industry has fallen in the UK (Figure 6), whilst at the same time it not only started at a higher level, but has grown in other key European markets. For example, Germany had 104,605 people employed in the industry in 2009, and by 2015 it had risen to 114,069 according to EFPIA figures. The trend is the same when looking at OLS figures too.
Figure 6: Employment in the UK pharmaceutical industry, 2010 to 2015
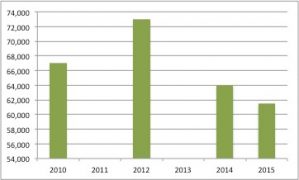
Source: Data from EFPIA annual key figures on the European pharmaceutical industry
The UK has recently improved on trade balance on pharmaceuticals, yet looking back to 2009 – when the previous PPRS was in place – shows that the UK has seen a worsening position over time (Figure 7). Just as with employment, Germany not only had a higher balance of trade, but it grew over time too from €13 billion in 2009 to €26 billion in 2015.
Figure 7: UK trade balance in pharmaceuticals, 2009 to 2015, EUR millions
Source: Data from EFPIA annual key figures on the European pharmaceutical industry
The same pattern is seen for gross value added too; the UK has seen a decline whilst Germany, amongst other European countries, has seen growth (Figure 8).
Figure 8: Gross Value Added in pharmaceuticals, selected European countries, 2009 to 2015
Source: Data from OLS annual life sciences competitiveness indicators
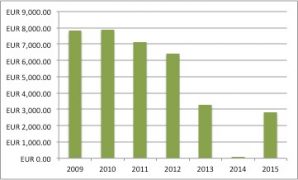
Industry spend on R&D has fallen too in the UK (Figure 9); the opposite to Government funded R&D (Figure 5).
Figure 9: Industry research and development spend, UK, 2009 to 2015, £ millions
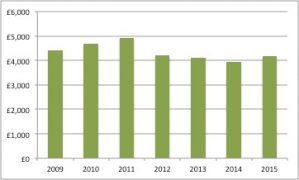
Source: Data from OLS annual life sciences competitiveness indicators
Life sciences a priority for Government
The UK pharmaceutical industry is arguably going through one of the most uncertain periods in recent memory. At the same time, there are ambitions for the UK to be the best place in the world to invest in life sciences. Current indicators don’t paint a totally convincing rosy picture; falling employment and falling industry investment would be a concerning trend from a Government perspective. And those trends were present before the vote for Brexit and the turbulence that has, and will continue, including the loss of the European Medicines Agency (EMA) from London to Amsterdam and the bouncing around in the value of sterling.
Perhaps it’s a reflection of both the priority of the sector and in recognition of the uncertainty that cannot be helpful for an industry that has to take a long-term perspective when investing that has prompted a slew of activity from the UK government. Life sciences was name checked as part of the Building our Industrial Strategy Green Paper in January 2017, followed up with a new Industrial Strategy and a Life Sciences Sector Deal, both published in December 2017. Government has been keen to highlight investments made by some big names in industry, including MSD, known as Merck in the US.
A new PPRS
The available indicators suggest that life sciences is still a key sector but perhaps one should not be taken for granted. It is also clear is that the 5 year nature of the PPRS doesn’t always align with being able to understand trends in innovation and growth, nor can it always align with unexpected – yet politically driven - changes in the landscape. One option is to ditch the link to innovation and growth from the PPRS; another is to more closely align it, perhaps by taking a longer-term perspective.
Could the current deal be rolled over to cover the period up to Brexit and the next General Election? That might not suit all, but it would give both industry and Government an opportunity to organize themselves and their thoughts after the distraction of Brexit and allow efforts like the life sciences deal to bed down a little. Of course, whether that is attractive or not depends on how you view the current PPRS and views on that are arguably as diverse as the trends seen in innovation and growth indicators.
About the author:
Leela Barham is an independent health economist and policy expert who has worked with all stakeholders across the health care system, both in the UK and internationally. Leela works on a variety of issues: from the health and wellbeing of NHS staff to pricing and reimbursement of medicines and policies such as the Cancer Drugs Fund and Patient Access Schemes. Find out more here and contact Leela on leels@btinternet.com.