Nice numbers at 20: what end-of-life evidence does NICE draw on?

NICE may be 20 this year, but its policy on end-of-life (EoL) treatments – where NICE can recommend a treatment at around £50,000 per Quality Adjusted Life Year (QALY) – is a young policy in comparison, being introduced in 2009. That’s still long enough to explore just what evidence NICE will consider when it decides to apply EoL flexibilities. Leela Barham takes stock.
The very first EoL policy was implemented in 2009. Under this policy, Appraisal Committees (ACs) can be flexible in accepting less cost-effective treatments but only where they meet certain criteria. The policy used to consider size of the patient population and whether other indications existed, but the policy from 2016 dropped these and now focuses on:
- Treatments for those patents who have a short life expectancy (LE), normally less than 24 months
- Treatments that offer an extension to life (EtL), normally of at least an additional 3 months, compared with current NHS treatment
AC’s will pass a critical eye over the evidence used to support meeting these criteria. Some treatments won’t have all the evidence that committees want to see because, for example, overall survival hasn’t yet been met. That means that committees need to consider analysis that tries to overcome such gaps.
It seems that AC’s have been convinced that the case has been made for EoL to apply: from 389 final TAs published from January 2009 (when the policy was implemented) to December 2018, EoL has been applied in 76 final TAs and applied to 77 recommendations out of 514 recommendations NICE has made.
Contribution to positive recommendations
Stakeholders are rightly interested in the application of EoL because it seems to make a difference to the recommendation that a treatment will get from NICE; there are a high proportion of treatments that have secured a positive recommendation when EoL has applied (figure 1).
Yet it is still the case that NICE will reject a drug even with EoL flexibility, in part, because it’s not just a matter of the cost-effectiveness with some treatments coming near the EoL threshold but still not getting the green light from NICE (figure 2).
It’s also somewhat difficult to work out what the EoL threshold in practice; in many cases there is a range of cost per QALY estimates provided, or in some cases, they are confidential. It does appear that NICE ACs are willing to accept more than £50,000 although an upward trend in the EoL threshold over time is hard to discern.
Figure 1: NICE recommendations for treatments where EoL has applied
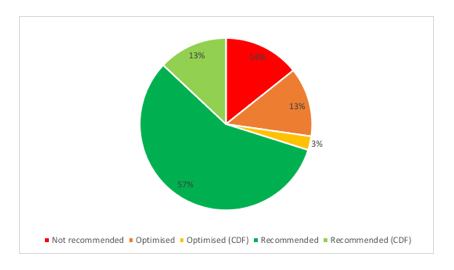
Source: Analysis of NICE final TA guidance
Figure 2: Cost per QALYs for treatments where EoL has applied and recommendation
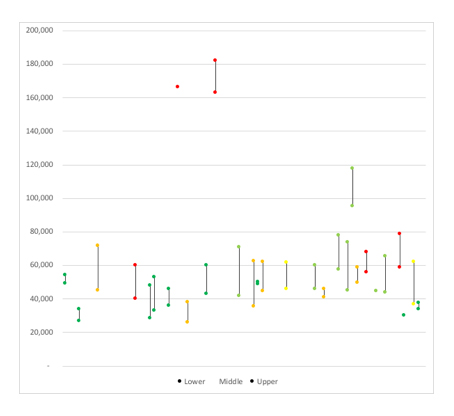
Source: Analysis of NICE final TA guidance. Dark green = recommended, light green = recommended in the cancer drugs fund (CDF), orange = optimized, yellow = optimized in the CDF, red = not recommended. Note: In 54 TAs a clear cost per QALY estimate or range can be identified, in 5 instances, the cost per QALY considered for decision-making purposes was deemed confidential, in all others either the estimated was designated as above/below a specific estimate (e.g. 30,000, 50,000 or 100,000) so that the cost per QALY estimate that was used to inform AC recommendations cannot be identified with confidence.
Evidence to inform application of EoL
It’s always difficult to know exactly what has influenced AC decisions in general; cost-effectiveness is important, but is not the only factor. Similarly for the application of EoL, it’s not simply a case of mechanistically applying the criteria relating to life expectancy (LE) or extension to life (EtL).
Whilst it’s not going to give the whole answer – and won’t unpick the relative contribution of different factors – looking at what NICE says under the EoL section of their final TAs can give some clues.
For example, final TAs where EoL applied includes:
- Discussion on EoL using median or mean LE or EtL, or both, but this is only explicitly discussed in 34 of the 77 recommendations for LE, and 37 of the 77 recommendations for EtL
- Discussion on EoL includes a variety of evidence for LE or EtL be that a trial (explicitly mentioned for 30 recommendations for LE, and 25 recommendations for EtL) or modeling coming from the company (26 recommendations for LE, 22 recommendations for EtL) as well as expert views (14 recommendations for LE) or modeling from independent academic groups who critique company submissions (11 recommendations for EtL). In 30 recommendations where EoL applied, ACs looked at more than one source for LE and 13 recommendations for EtL
- Life years are rarely set out in discussion on EoL, being cited only in one final TA guidance document (TA488, regorafenib for previously treated unresectable or metastatic gastrointestinal stromal tumours)
The reason it matters whether ACs draw on median and means is because whilst they are both a measure of central tendency, they can and do differ, and often the mean needs to be modeled, making it uncertain. It matters too as in at least one case, the independent academic group has argued that EoL only applies to mean estimates; this is clearly not the case (based on reviewing public slides that are developed to identify key points to support AC deliberations). ACs appear to have taken a sensible approach of looking at what is available and triangulating when they can.
It also matters that ACs consider company submissions and the modeling that they do to be robust enough to inform their decision-making.
Uncertainty in estimates
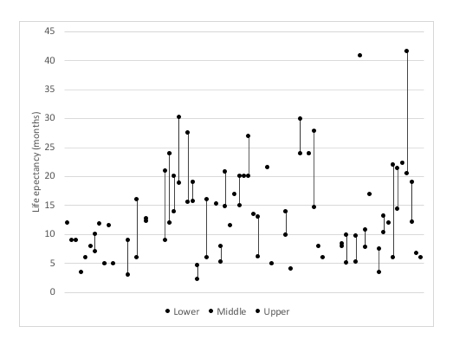
ACs have had to deal with uncertainty in the estimates available for both LE and EtL (see figure 3 and figure 4). Yet this also shows that it can often be unclear what estimates have been used, although that is in part because final TAs will often cross reference to other parts of the appraisal. This may save space in the write up of final TAs but it makes it less clear exactly what has informed decisions.
Figure 3: Available estimates for LE in TAs where EoL has applied
Source: Analysis of NICE final TA guidance
Figure 4: Available estimates for EtL in TAs where EoL has applied
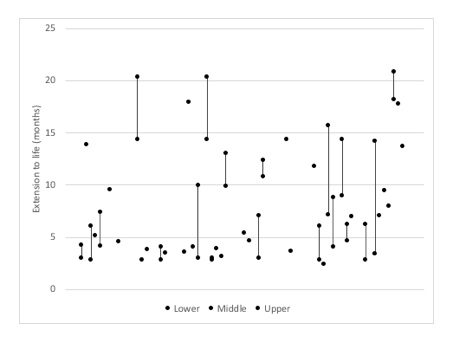
Source: Analysis of NICE final TA guidance
Relative versus absolute gains in survival
The EoL policy doesn’t mention the relative gains in survival, although ACs have considered relative gains from treatment. This includes the TA of trifluridine–tipiracil for previously treated metastatic colorectal cancer (TA405) where the final TA notes that adding 3.2 months to a life expectancy of 7.9 months is a clinically meaningful benefit. In the case of paclitaxel as albumin-bound nanoparticles (nab-paclitaxel) with gemcitabine for untreated metastatic pancreatic cancer (TA476), the survival gain of 2.4 months was seen as particularly important relative to average survival of 6 months. In essence, even a very small survival gain can make a big difference if life expectancy is very low.
Flexibility in application
Committees have also shown flexibility in applying the criterion, for example applying EoL even when there may be a higher LE than the 24 months specified in the policy, as demonstrated in the case of trastuzumab emtansine for HER2-positive advanced breast cancer after trastuzumab and a taxane in TA458.
AC’s have also applied flexibility to EtL: in the case of paclitaxel as albumin-bound nanoparticles (nab-paclitaxel) with gemcitabine for untreated metastatic pancreatic cancer in TA476 the Committee accepted 2.4 months estimate for extension to life, because of the relative gain for patients.
Making the case for EoL
Whilst there remains a debate about whether the EoL policy should even exist as it puts cancer patients in a preferential position against others, it is clear that it has withstood ten years of that debate. The EoL policy as applied by NICE committees has, rightly or wrongly depending upon your viewpoint, enabled patients to access drugs that offer more time and helped companies achieve market access. The cancer drug pipeline is a busy one, and it likely includes end-of-life treatments, so stakeholders may well want to know how they can best make the case for EoL to apply.
It would seem that the best chance of having EoL apply is when the company can put together a robust model, but not only that, provide evidence to help committees to triangulate estimates for LE and EtL. Looking for and providing a range of estimates is a useful strategy.
Yet it’s not always clear what has been taken into account. That makes it hard for stakeholders to know just what made the difference and allowed EoL to apply. In part, that’s because this work has scratched the surface; the final TA, and even if public slides are available, are only summaries of the far more extensive evidence ACs have to consider. The number of pages of the various documents that support the TA process can run into hundreds and hundreds.
Whilst NICE may dislike the notion of precedence, precedents can be important to companies in making a case for their own drug. This means that companies can and should look to decisions made in the past; this is especially important if there are challenges that can be countered by pointing out how committees have applied EoL, and not just the interpretation of the policy by some. With 76 TAs seeing EoL applied, there could be a lot of lessons for companies to learn by digging more deeply.
About the author
 Leela Barham is an independent health economist and policy expert who has worked with all stakeholders across the health care system, both in the UK and internationally, working on the economics of the pharmaceutical industry. Leela worked as an advisor to the Department of Health and Social Care on the 2019 Voluntary Scheme for Branded Medicines Pricing and Access (VPAS).