NICE numbers at 20
Leela Barham takes a look at NICE’s stats on Technology Appraisals to see how the agency has changed over it’s 20-year history and what the future might hold.
The UK’s world-renowned Health Technology Assessment (HTA) agency, the National Institute for Health and Care Excellence (NICE), turned 20 in April 2019. There have been a few who have reflected – in qualitative terms – on the job NICE has done. Yet with NICE making a host of improvements on transparency, the Institute now provides a user-friendly set of graphs that summarise its work on Technology Appraisals (TAs) plus a downloadable excel file, so we can look quantitatively at how the agency has done over time too.
A changing workload
NICE’s webpage on TA statistics includes guidance published since 2000. The agency's commentary points out that it is appraising more medicines and treatments than ever before, aiming to publish 75 appraisals in 2019/20. That compares to 21 back in 2000/01.
NICE is right to highlight just how much it now has to do under the TA programme – and with less. Like many NICE has had to tighten their belt in these cash constrained times so presumably the Institute has become more efficient at doing TAs over time – but there are some other points to note when it comes to how much work NICE still has to do.
NICE cannot afford to stand still when it comes to giving their views on the effectiveness and value for money of technologies. Things change; be that the price, the evidence base, or the comparator. The agency has a process to help deal with this and plans for reviews of their TAs. NICE can decide as part of their review that there is a need for change, or to put a TA on the static list. Analysing NICE’s excel sheet makes it clear that there is real work done to keep TAs up to date, with 87 recommendations being updated between 2000/1 and 2018/19 (the latest year for which full data is available). Updating has been done for around 10 percent of all recommendations from TAs. As you’d expect, much of the updating is replacing the older TAs (figure 1).
It is important to note the work involved in staying current; with many countries setting up HTA of medicines (Japan as a notable current example) policy makers need to consider capacity required. Companies too need to think about the next time around with NICE, since they too need to do their homework to support the agency updating TAs. Plus when thinking about the potential to share more and avoid duplication, it’s useful to think about how NICE might avoid the same updating needing to be done elsewhere by other HTA agencies, at least when it comes to the clinical effectiveness part of TAs.
Less of a worry is work done that is now no longer needed; in only a handful of cases has NICE appraised a technology that has subsequently stopped being available in the UK (figure 1).
Figure 1: Status of NICE Technology Appraisals (TAs), 2000/1 to 2018/19
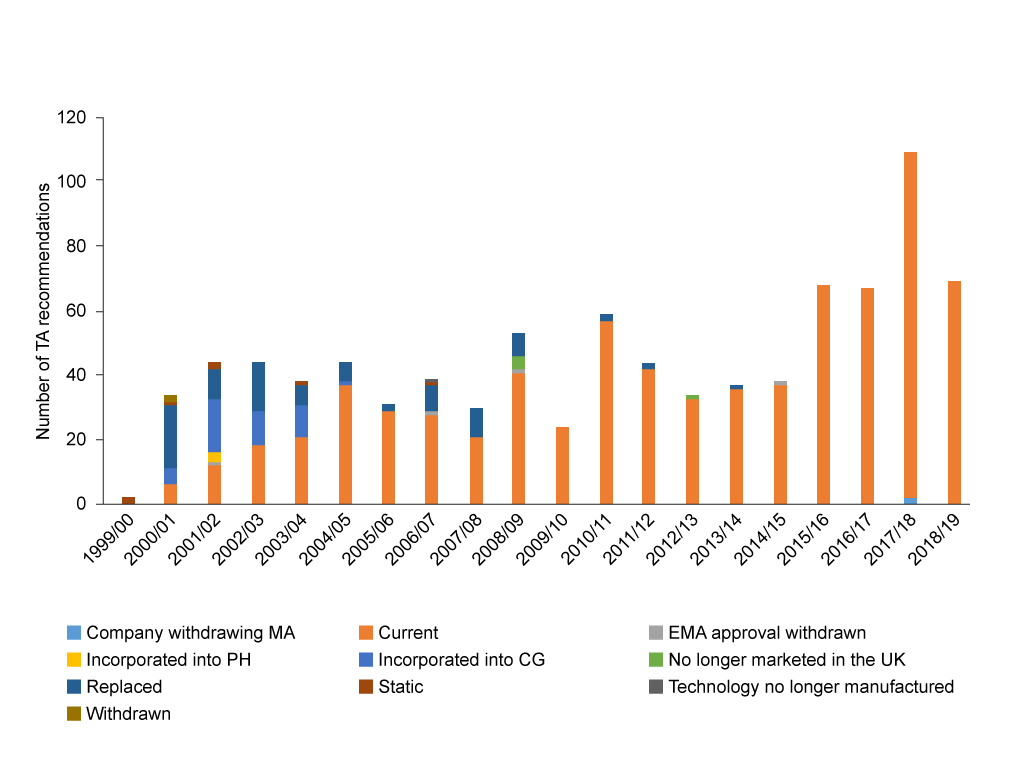
Source: Analysis of NICE data. EMA = European Medicines Agency. CG = Clinical Guideline. PH = Public Health Guideline.
Yet on the other side, NICE’s workload is less when manufacturers don’t submit. In those cases, the agency simply stops the appraisal. Worryingly this is happening more often over time (figure 2). When NICE reports these in board papers they are classed as additional topics published but not planned, making them sound more like a good thing than a bad thing.
What is driving the increased trend in non-submissions is a difficult one to unpick because it’s not clear who is to blame; some might say this reflects the agency not using appropriate methods and processes, others might lay the blame with companies. Even that isn’t clear cut; the attractiveness of launching a drug in the UK is complicated by the shifting attractiveness of other countries as well as policies pursued by the UK government and the commercial drive of the company.
What is clear though is that this leaves a gap; there will be patients and clinicians who may well face challenges getting access – if companies still launch even if they don’t do the NICE TA – depending upon local approaches to decision-making when NICE TA guidance doesn’t exist. To add to that, NICE is now charging companies for TAs, so it will also reduce their income too. The agency will need to amend charges over time, and non-submissions could spread the smaller cost of starting but then stopping a TA, across all the charges made for TAs that are competed and paid for by the companies involved, in the future.
Figure 2: Non-submissions to NICE Technology Appraisal (TA) programme, 2000/1 to 2018/19
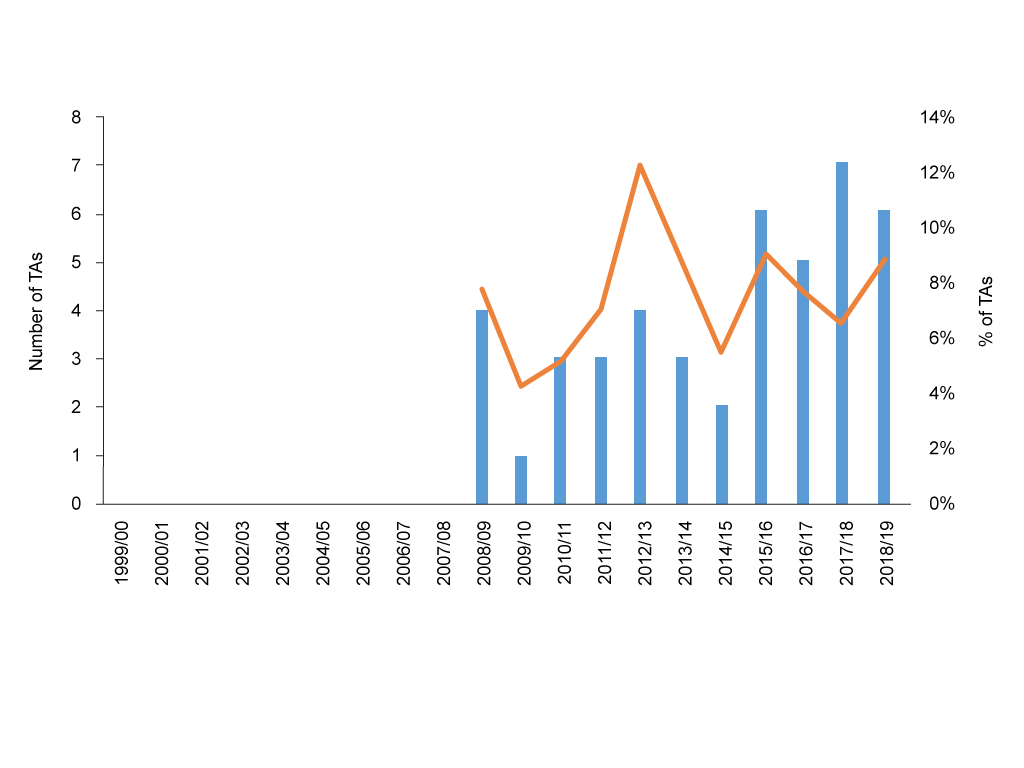
Source: Analysis of NICE data.
A focus on pharmaceuticals
You’d be forgiven for thinking NICE only looks at pharmaceuticals as part of its TA programme, after all, pharmaceuticals account for 90% of all TAs conducted between 2000/1 and 2018/19. There’s even been some years where no other technologies have even had a look in (figure 3). In fairness though, the agency offers routes to explore the effectiveness and value for money of other interventions as part of their wider work. The focus on TAs by others outside of the agency is probably a source of frustration to its workers.
Figure 3: NICE Technology Appraisals (TAs) by technology type, 2000/1 to 2018/19
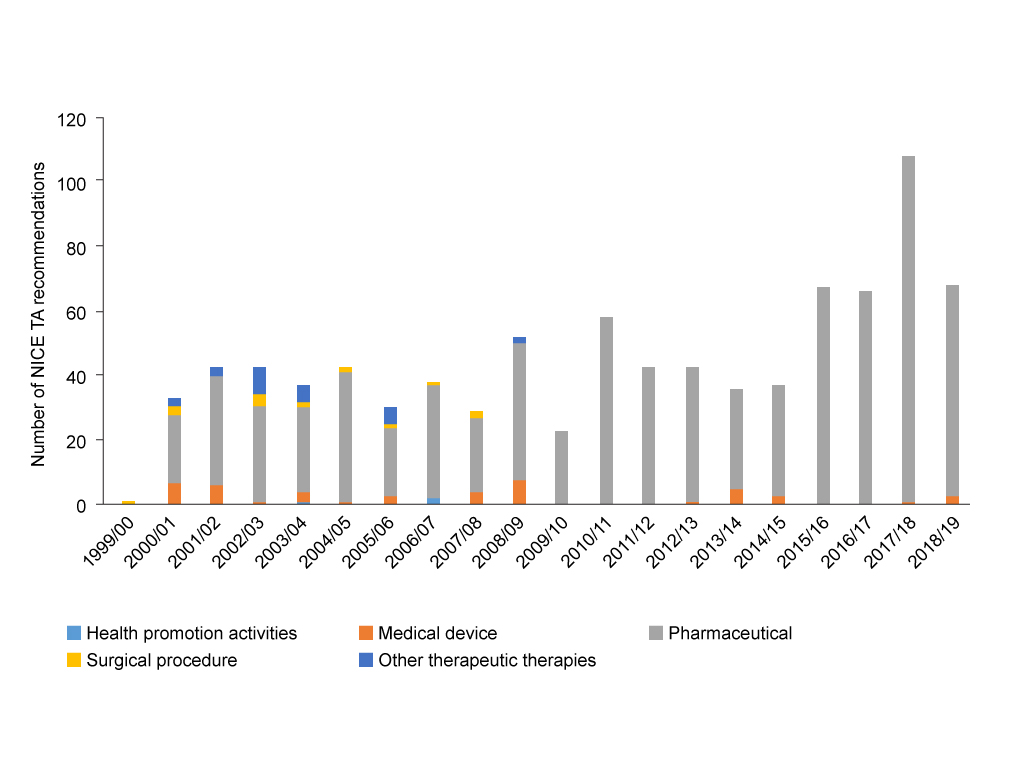
Source: Analysis of NICE data
More nuanced recommendations for pharmaceuticals
Perhaps understandable against the backdrop of ever more complex science that sits behind the new drugs coming to market – as well as the drive for faster access for the most promising drugs, even if that means accepting less mature evidence – the recommendations that Appraisal Committees (ACs) have been making have become more nuanced.
Back in the first days of NICE the options were pretty limited; essentially a no or a yes. Fast forward to 2019 and ACs can now choose from saying yes, no, or can opt for use only in research when there is a need to find out more and wider use isn’t yet justified – or can opt to provide interim funding via the Cancer Drugs Fund (CDF) for those cancer drugs that look promising, but where there may be some uncertainties in the evidence or the cost effectiveness. This means that outright no’s have fallen over time, yet gone are the days of NICE giving the majority of drugs an unequivocal thumbs up too (figure 4).
Figure 4: NICE TA recommendations for pharmaceuticals, 2000/1 to 2018/19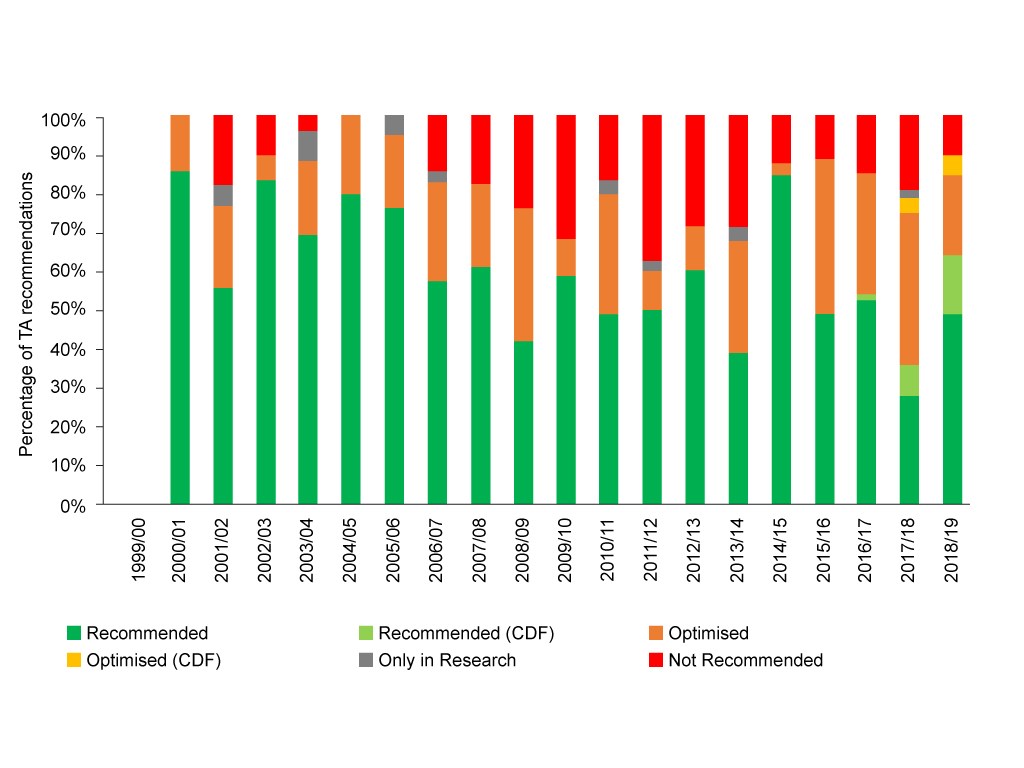
Source: Analysis of NICE data.
More statistics needed
The statistics that NICE now makes easily available are a marker for the improvements it has made in explaining and providing transparency in the activity and recommendations made in TAs. There are still big areas where it is hard for those outside the agency, or those who cannot afford to access specialist databases – such as patient groups – to get to grips with what is going on. Not least is the actual cost per Quality Adjusted Life Year (QALY) accepted and how this may – or may not – be changing over time. There’s certainly no neat time trend you can look at; it requires huge effort to abstract what is available. There is a suspicion that the real ones – those that reflect deals struck – are increasingly not available because often the full details of these deals are confidential.
As the agency has grown up it has become far more sophisticated in the way it works on TAs too, so there are arguably other statistics that stakeholders would be interested in, if they too were available easily.
That includes the take-up and repeat customers for early engagement work, though we know these generated £2.1 million gross income in 2017/18, and board papers report uptake throughout the year. Repeat customers would really help NICE make the case that it is useful for companies to take up these services. Numbers of how many of these early engagements involve patients and their representatives would be useful too, in order to illustrate the patient involvement that goes on behind the scenes. Just as EMA routinely do, NICE could also report in final TA guidance if early engagement took place without revealing what the discussions were. That would allow, just as for the EMA, an analysis of what difference this has made.
It would also be useful to know what take-up there is of opportunities for involvement from patients, professionals and others who NICE works hard to identify and invite to take part in TAs. The agency hides the huge workload involved in this by not providing statistics on the number of organisations invited specifically for Tas; board reports only cover patient and public committee member recruitment. NICE also misses a trick in publishing the number who take it up – or not – as the case may be.
With goals set for timeliness as part of the 2019 Voluntary Scheme it would be useful to see speed of TA work too as a routine statistic. A NICE Key Performance Indicator (KPI) as part of their balanced scorecard doesn’t provide a breakdown for how fast STAs are published, just the percentage that are published within six months of first UK license. Another KPI sets out the percentage of MTAs going to ACD in 41 weeks or to FAD within 44 weeks. Needed now is the speed of cancer TAs and the speed of non-cancer TAs. This is not just to hold the UK government to account for their commitments under VPAS, but because speed matters to the patients and their clinicians.
It would also be useful to know just who holds things up; is it NICE processes going awry or is it companies behaving badly and not giving the agency what they need? Sometimes insights come from NICE board reports, but it’s not brought together nor it is easy to see if things are getting better or worse. Having standard statistics would also enable an exploration to see if changes made by the agency – such as the technical engagement introduced as part of TAs – has helped to speed things along or not. It might also be interesting to explore the impact on appeals, but that’s hard too as there isn’t easily available trend data on these either.
Then there’s the matter of the true impact of NICE TA guidance; just who gets what and how much that really costs the NHS. Some of that work is being done, but it’s hard to take stock of the big picture over time.
What will the next 20 years hold?
There remains a rich – and controversial – debate about the agency and where it is doing well, and where it can do better on TAs. Calls have been made in the past for a review, and now a review of NICE methods and processes for TA is in train. NICE is expected to consult publicly in 2020, but according to various sources is doing a great deal of pre-consultation consultation now. There may be more improvements made as a result of the review. Of course, that depends upon your perspective; for some keeping the best of the agency will mean limited changes, for others it’s more radical change that they want. But we can rest assured that NICE will remain.
About the author
 Leela Barham is an independent health economist and policy expert who has worked with all stakeholders across the health care system, both in the UK and internationally, working on the economics of the pharmaceutical industry. Leela worked as an advisor to the Department of Health and Social Care on the 2019 Voluntary Scheme for Branded Medicines Pricing and Access (VPAS).