Mapping the crisis: How data can help fix America’s growing pharmacy deserts

As major pharmacy chains like Walgreens continue to close hundreds of stores nationwide, pharmacy deserts are increasing across the US. These closures put medication access, affordability, and adherence at greater risk.
Nearly one in seven Americans already live in a pharmacy desert, and that number continues to climb, particularly in rural and low-income communities. These closures, compounded by the decline of independent pharmacies, create a critical gap in care. While mail-order and mobile delivery options can help, the most important step is understanding where these gaps exist and who they affect the most.
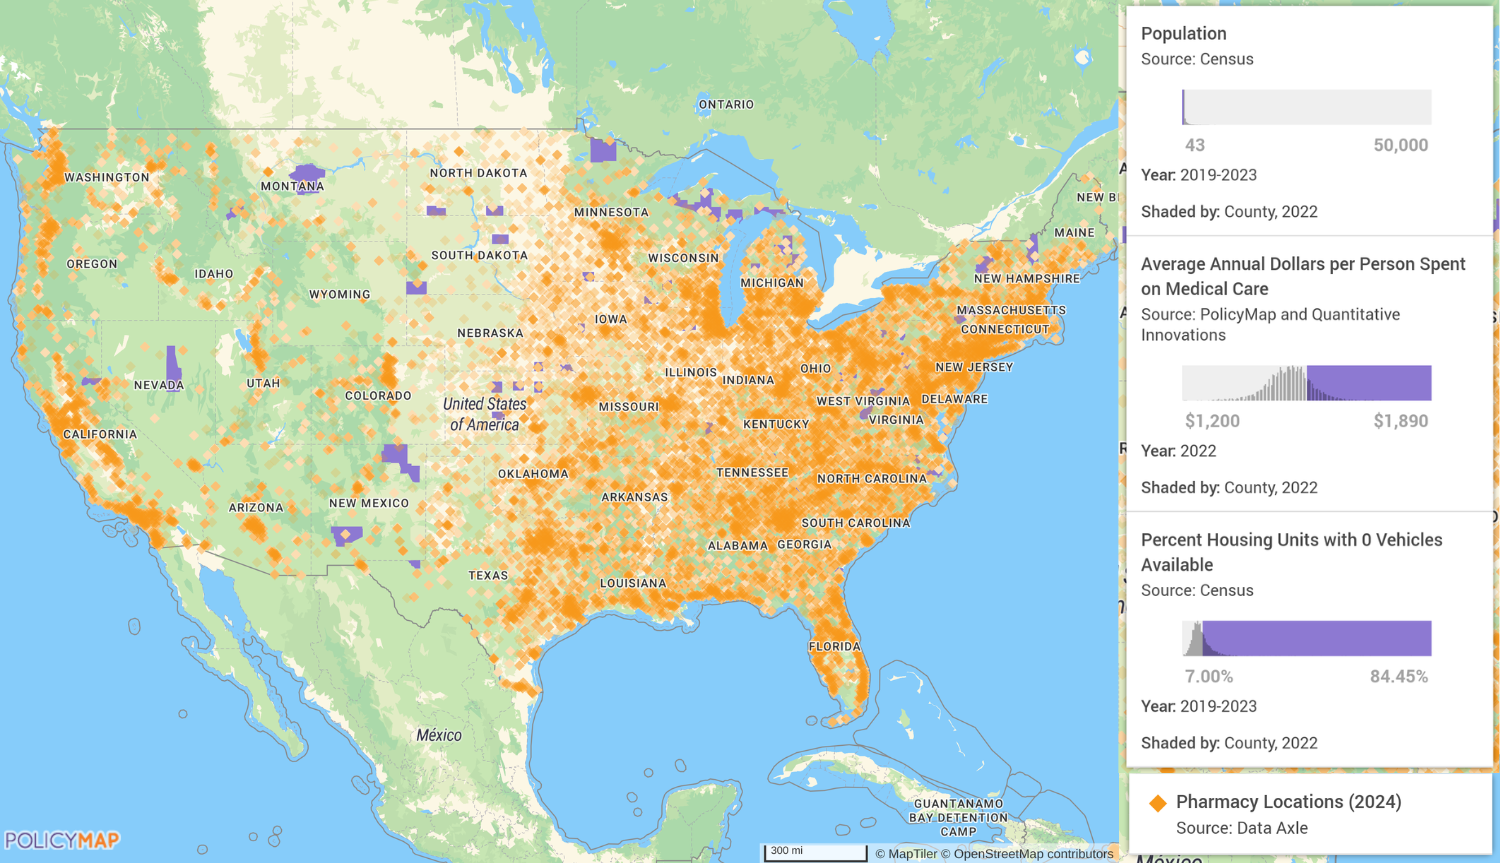
Today, 45% of US counties meet the definition of a pharmacy desert. That means large segments of the population must travel significant distances to access essential medications. But solving this challenge requires more than simply counting how many pharmacies exist in a given area. True visibility comes from layering pharmacy locations on top of geospatial data, such as population density, income levels, transportation access, insurance coverage, and health burden. These insights allow pharmacy benefit managers (PBMs), healthcare organisations, and local leaders to make strategic, community-focused decisions that expand access and close disparities.
The expanding pharmacy desert crisis
The rise of pharmacy deserts is a growing national concern with serious implications for health equity. On average, per 10,000 residents, rural counties have just 1.72 pharmacies, while large metropolitan areas have over 78. When even a single pharmacy closes in a rural area, the impact is immediate. Patients may face reduced medication adherence, worsening chronic conditions, more frequent emergency room visits, and increased out-of-pocket costs.
Certain states are impacted more than others. Oklahoma and California, for instance, have among the lowest pharmacy densities in the US, with less than two pharmacies per 10,000 residents. This is where the value of multilayer mapping using granular-level geospatial data helps illustrate where access is most fragile. For example, PolicyMap analysis finds that counties with fewer than 50,000 residents, over $1,200 in annual medical spending per person, more than 7% without access to a car, and one or no pharmacies are among the most vulnerable communities.
Examples include Eureka County, Nevada; Harding County, New Mexico; Fall River County, South Dakota; Fergus County, Montana; and Koochiching County, Minnesota. These are areas where losing even one pharmacy can leave residents without any reliable option for filling prescriptions. In some cases, people may need to drive for hours to access basic medication services. In others, transportation challenges, limited mobility, or fixed incomes make that impossible.
National averages do not tell the full story
National averages are just the tip of the iceberg when it comes to where pharmacy deserts are forming and how they impact specific communities. For example, per capita out-of-pocket prescription drug spending is projected to grow from $175 in 2024 to $227 by 2032, a 3.3% annual increase. With that in mind, some of the highest-spending states, such as North Dakota, Pennsylvania, and Vermont, also have counties with very limited pharmacy access, suggesting that national averages may overlook additional hidden costs like transportation and time required to reach distant pharmacies.
But, low prescription drug spending does not always mean better access. While urban areas, in general, tend to have more pharmacies, there may still be barriers such as limited hours and closures, stock shortages, language barriers, costs relative to income, and local infrastructure that contribute to pharmacy access challenges. This is where geospatial mapping becomes essential. Data allows PBMs and healthcare leaders to understand which populations are most at risk beyond what national or state-level averages might suggest. It provides a clear, localised view of where pharmacy deserts are growing and who is being left behind.
Using data to inform PBM & healthcare org strategy
For PBMs and healthcare organisations, data can do more than identify where gaps exist today. It can help predict where future closures are likely to deepen disparities. This predictive capability is vital as national chains adjust their store footprints in response to financial pressures, labour challenges, and shifting consumer behaviours.
For example, using geospatial tools, PBMs can pinpoint rural counties with no pharmacy presence, high medical spending, and low rates of car ownership. With this knowledge, they can prioritise investments in mobile delivery and telepharmacy, or even negotiate contracts that preserve access in areas at risk of becoming deserts. Rather than applying broad, one-size-fits-all solutions, PBMs can adopt more targeted approaches that reflect the needs of each unique community.
Importantly, this type of insight also supports smarter negotiations around drug pricing. In communities where there is only one pharmacy – or none – there is no competition to drive down prices. By identifying these regions, PBMs can better advocate for fair pricing models that reflect real-world access challenges.
Driving health equity through data-driven decision making
The people most at risk in pharmacy deserts – older adults, low-income individuals, and those with chronic illnesses – are the very ones who need timely medication the most. By combining demographic, health, and infrastructure data, geospatial tools display where these populations live and what unique barriers they face. This assists PBMs and healthcare providers to proactively design programmes that meet people where they are, whether that’s investing in mobile delivery, expanding telepharmacy, or simply ensuring that one pharmacy stays open in a high-risk county.
To close the pharmacy access gap, healthcare leaders must adopt a data-driven, community-focused approach. Standardising pharmacy access mapping within PBM and provider networks can help identify underserved areas while collaborating with local healthcare leaders ensures alignment with broader public health goals. Investing in innovative delivery models, using data to inform resource allocation, and ensuring community input are all essential.
These strategies will not only improve medication adherence and affordability, but they will also build trust, reduce disparities, and create stronger, more resilient systems of care.
About the author
 Maggie McCullough is the founder and CEO of PolicyMap, a leading geospatial data and mapping platform advancing the use of social determinants of health (SDOH) data to drive equitable health outcomes. Drawing on her career in city, state, and federal government, McCullough has dedicated her work to making complex information accessible and actionable. This commitment, combined with her vision and leadership, led to the launch of PolicyMap in 2008. Today, the platform is a trusted partner for healthcare organisations, pharmaceutical companies, and researchers addressing health disparities in communities nationwide.