Using forecasts to enhance decision making in pharma
Arthur Cook explains how the wider benefits of forecasting can inform all aspects of the business and, in turn, bring greater success.
What is a forecast? In the pharmaceutical industry, we generally regard a product's 'forecast' as a measure of its revenue potential. As such, the forecast is used in multiple planning functions within a company. It is a critical input to such diverse activities as managing R&D portfolio prioritisation, setting incentive goals for the selling organisation, directing manufacturing activities and focusing government policy efforts. In all pharmaceutical companies, there is a spectrum of analytical processes that support these planning activities but, in virtually all cases, the revenue forecast is an integral input.
"A forecast is more than just a revenue number. It is a representation of future environments"
But a forecast is more than just a revenue number. It is a representation of future environments, based on a logic construct that examines a number of input assumptions as well as the uncertainty in these inputs. In many organisations, this uncertainty is swept away or 'hidden' when only the most likely forecast value is used in planning. This leads to suboptimal decisions where management is not exposed to the risk inherent in decisions about the future.
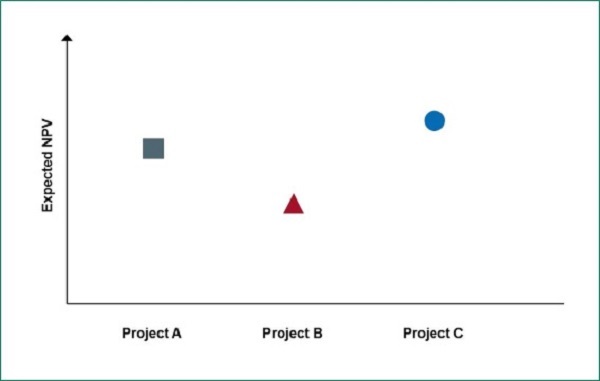
For example, consider Figure 1 below. When asked to prioritise projects for development and/or other funding, most decision makers would select Project C as it has the highest expected net present value (NPV).
Figure 1
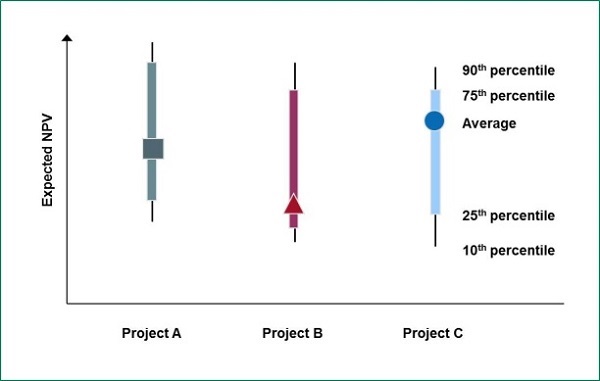
However, when uncertainty bands are added to the forecast, as shown in Figure 2, the decision becomes more complex. Project C becomes a high-risk decision, Project B is a low-risk decision and Project A represents a more balanced risk profile. In this example, the decision maker can now incorporate risk in project selection as well as the expected NPV. The selection decision between projects has become more informed and well considered.
Figure 2
There are other analytical constructs a forecaster can use to enhance decision making with a firm by increasing the transparency of forecast uncertainty. Chief among these is the use of tornado diagrams (Figure 3) to describe the uncertainty in input assumptions.
Figure 3
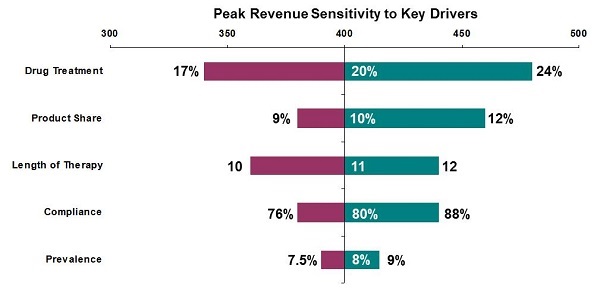
The tornado diagram gets its name from the shape of the graph, where wide bands appear at the top of the diagram dropping down to narrow bands at the bottom. To interpret the diagram, first focus on the centre, where the 'most likely' values for each assumption are aligned (that is, 20 per cent for drug treatment, 10 per cent for product share, and so forth). When these most likely values are used, the resulting forecast can be read on the top scale, in this case 400 million.
Next examine the range of forecast governed by the range of possibilities for each input assumption. For example, if the drug treatment rate is at its lower value of 17 per cent, the resulting forecast is approximately 340 million (as read on the top scale). If the drug treatment assumption is at its high range of 24 per cent, the forecast would be approximately 460 million.
Better decisions
How does this uncertainty analysis enable better decisions? First, it focuses the decision maker on those variables that matter the most in changing the revenue forecast. In the example above, programmes designed to increase drug treatment rates could probably result in a more significant increase in revenue than programmes designed to increase compliance.
Next, tornado diagrams serve as a road map for reducing uncertainty in the forecast. If the firm requires a forecast with a 'tighter' range, it would focus efforts on refining the drug treatment assumptions rather than refining the prevalence data. Analogously, this analysis indicates inherent uncertainty that may not be removed. For example, the length of therapy may accurately represent patient response rates and cannot be refined any further.
As a caveat, the analytics for generating tornado diagrams do not take synergies among the input variables into account. For each assumption, its range is created by holding the values for the other inputs constant at their most likely values. To the extent that cross-assumption synergies occur, this approach to uncertainty analysis will not capture them.
The final benefit of exposing uncertainty is to enhance planning for the functional areas affected by the forecast. Forecasting is an input to multiple functional areas within a firm: finance, marketing, sales, operations, corporate strategy and so forth. Using a single forecast to drive all planning functions is misleading. For example, finance would use a 'most likely' value in planning, marketing may use an 'aspirational' value to set goals and operations may use a 'maximum' value to ensure capacity to meet maximum demand.
A ranged forecast, as represented in Figure 4, enables a single forecast to be used as input for multiple functional areas. This enhances each functional area's ability to plan, and to understand the possible different outcomes that may arise in the market. For example, the operations group may now develop a plan that considers the possibility of greater-than-anticipated product demand ... and the probability at each point along the demand curve.
Figure 4

Conclusion
So, having answered the question of what a forecast is, the next question is what is the job of a forecaster? One of the most prevalent answers is 'to accurately predict the future'. As discussed, this is but a partial answer. The job of a forecaster is more expansive: to create a logical framework in which future events can be quantitatively evaluated and to present the uncertainty inherent in predicting the future. By doing this, the forecaster allows an organisation to make more informed and presumable decisions.
The job of the forecaster is to create stories that paint a dynamic picture of the future, not to simply create spreadsheets.
About the author:
Arthur G Cook is a Principal at global sales and marketing consultancy ZS and leads the firm's Pipeline Strategy practice. He has worked with many of the premier companies in the pharmaceutical industry, across 25 countries, and has developed forecasts for products in more than 150 different therapeutic areas. His experience spans strategic planning, forecasting, market research, pricing and decision analysis. He is the author of Forecasting for the Pharmaceutical Industry (second edition; Gower Publishing).
Read more from ZS: