Strategy and evaluations part three: estimating discount rates

Jean?Louis Roux Dit Buisson
Foro Ventures
In the final part of Jean-Louis Roux Dit Buisson’s trilogy, he discusses how pharma companies can estimate their discount rates, looking at risk premiums.
(Continued from “Strategy and evaluations part two: developing sales estimates”)
“Risk comes from not knowing what you are doing.”
Warren Buffet
In my previous articles, we looked through the eye of the practitioner in order to propose a new look at valuations, with company governance as the key “customer”: strategic decision making must focus on hypotheses and the likelihood of outcomes. In this article, we address the issues of estimating discount rates.
Risk
There is a lot of terminology confusion between risk-premium, discount rate, weighted average cost of capital (WACC) and capital asset pricing models (CAPM). In addition, the amount of work generated with sophisticated mathematical models currently contributes more to confusion than clarity for the non-academic practitioner and decision maker1.
Let’s use “volatility embedded in the estimates of future value of a parameter” as a proxy for “risk”.
 ,
"It is common practice that more risk comes with a higher discount rate."
 ,
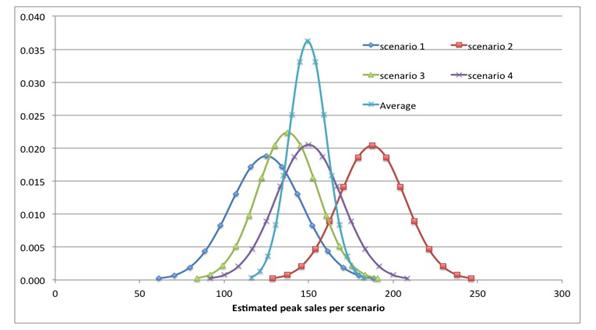
Volatility can be expressed as a continuous function / distribution or a discrete function (e.g. yes / no, 1 or 0, etc...)
The former is suited for variations of estimates around an anchor point, the latter for estimates of anchor points. A good example is shown in figure 1 below, where peak sales estimates are plotted for each scenario.
Figure 1: Peak sales estimates
It is common practice that more risk comes with a higher discount rate. But when it comes to determine which risk comes with which premium, there is still no generally accepted method by both the practitioners – to which we belong – and the academia.
“Conflicting approaches to calculating risk have led to varying estimates of the equity risk premium from 0 percent to 8 percent—although most practitioners use a narrower range of 3.5 percent to 6 percent…”2.
Market risk: continuous (uncertainty) and discrete (scenario) functions
Non-diversifiable commercialization uncertainties are related to geo-political tensions, competitive developments and new regulations:
Pal = Pf+ Pm
Pal = “after launch” premium, Pf = Risk free premium, Pm = non diversifiable market risk premium.
The current debate concerns which discount rate to use to calculate the value of future commercial cash flows obtained with the proposed scenario building methodology. The theory calls for Pf, while most non-financial decision makers will go for Pal.
However, if the project extends far enough in the future, the development phase risk premiums will make the most significant difference for early phase decision making.
Development risks: discrete values (pass rates)
Early on in projects, development phase outcomes are discrete in terms of technical results and potential product profiles.
 ,
"...which discount rate to use to calculate the value of future commercial cash flows..."
 ,
Numerous references exist – e.g. Tufts Center for the Study of Drug Development – with databases available for “pass rates”.
Evaluators ought to be very careful in selecting which pass rates to use, as most published in articles, websites and institutions do not necessarily reflect the nature of their own project, nor do they necessarily apply to their company’s track record. Due diligence is essential here.
According to the CAPM theory, pass rates should not have an influence on the discount rate, as they are theoretically diversifiable risks.
In reality, however, there is an observable direct relationship between success rate and risk premium. Discovery stage biotechs are facing >,20% discount rates, clinical stage companies a lower discount rate and marketing stage companies an 8% market risk premium – the average market risk premium is 7%, computed by McKinsey for the last few decades, and is based on GDP. For the sceptics, P / E ratios is another metric of the same perception of risk.
Two additional premiums are added by the market in the evaluation of global risk:
Pal = Pf+ Pm + Pi + Pc
Pi = an industry related premium, Pc = a company related premium generally accepted as reflecting the risk associated with the company track record on delivering on promises1, 3.
This approach has led to the market derived capital asset pricing model (MCPM), which tends to overstate the influence of company and industry specific risks.
 ,
"...systematic risk will likely increase with R&,D intensity..."
 ,
Myers and Shyam-Sunder3 explain why, given the implicit leverage associated with R&,D, systematic risk will likely increase with R&,D intensity and be greater for early stage projects compared with more mature projects.
So how can you assess the risk premium that is allocated as a function of development stage? And for which purpose?
Estimating risk premiums
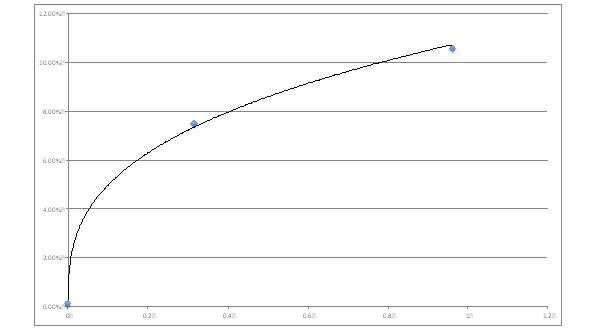
Modern add-ons assist in deriving estimates for phase related risk premiums. You need to have 2 points and to realize that the risk aversion is increasing as risk increases (see figures 2 and 3 below).
Figure 2: risk related risk premium estimates
Which risk premiums would you use to estimate the value at the entry of the different phases of the project? Which risk premiums to evaluate the project as a whole?
The answer lies with which viewpoint you take: are you looking at a value or estimating a price? Or at the value of project in the hands of company A, or in the hands of management team B? Or just at the current phase of development as a short term investment?
Figure 3: Risk premiums, risk related discount rates, whole project
Marginal vs fully costed cash flows
Should a risk premium be added when only direct marginal cash flows are used in project projections? Proponents argue that marginal cash flows are more volatile. Even if correct, the issue remains as to how to compute the associated risk premium and for which purpose. In our practice, we consider all project related cash-flows as marginal, and we incorporate fixed costs analysis when dealing with company valuations.
References
1. Cost of Capital for Pharmaceutical, Biotechnology, and Medical Device Firms, Scott E. Harrington Alan B. Miller Professor Health Care Management The Wharton School University of Pennsylvania
2. Mc Kinsey quarterly OCTOBER 2002 • Marc H. Goedhart, Timothy M. Koller, and Zane D. Williams
3. Myers, S. and L. Shyam-Sunder, 1996, Measuring pharmaceutical industry risk and the cost of capital, in R. Helms, Washington, D. C., American Enterprise Institute.
About the author:
Jean-Louis Roux Dit Buisson is a Professor of Entrepreneurship at the Grenoble Management School in France. He is founder of Foro Ventures, a company dedicated to provide assistance and interim management for top-line growth projects and turn-arounds.
Jean-Louis is specialized in high technology sectors (such as Bio Pharma, Medtech). He has an MSc from MIT and an MBA from INSEAD and can be reached at jl@forotech.ch.
How can pharma best estimate discount rates?

