Just how much does the NHS spend on medicines?

The current general election has highlighted once again the burning issue of NHS spending. However putting a figure on its medicines spending is far from straightforward.
It has become increasingly difficult to answer the simple question of how much the NHS across the UK spends on medicines. That reflects a number of factors: the NHS is a devolved responsibility so there is spending on medicines that is measured in separate data across the four nations of England, Ireland, Scotland and Wales. So to simplify, let’s focus on England and look into the complexities of NHS spend on medicines in just one nation of the UK.
NHS gross spending on medicines in England: in absolute terms, high and growing fast
NHS Digital provides statistics on spending on medicines in the community and in hospital. Their most recent statistics go up to the financial year 2015/16, but also provide the trends by going back to 2010/11 (figure 1). The headline is that the NHS in England undeniably spends a lot on medicines – there’s no way that over £16 billion can ever be seen as inconsequential - and it’s been growing overall, particularly driven by the costs of hospital medicines (figure 2).
Figure 1: Estimated prescribing cost to the NHS in England, £bn 2010/11 to 2015/16
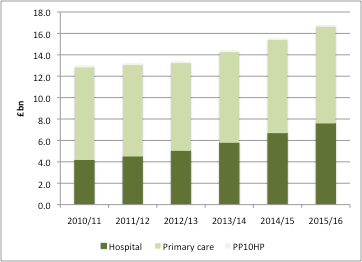
Source: Data from NHS Digital excluding discounts. FP10 is prescribing of controlled substances.
Figure 2: Annual estimated prescribing cost growth, 2011/12 to 2015/16
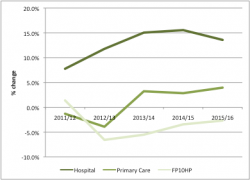
Source: Data from NHS Digital excluding discounts. FP10 is prescribing of controlled substances.
NHS gross spending on medicines in England: in relative terms, small and growing slowly
Spending on prescriptions needs to be seen in the wider context: after all, there is much else that the NHS spends on. Taking this wider context suggests that the cost of prescriptions has risen only a little from 2010/11 to 2015/16: increasing in the share of NHS funding from 12.9% in 2010/11 to 14.3% by 2015/16 (figure 3). Taking an even wider context: it’s somewhere in the region of 1% of the UK’s GDP.
Figure 3: Funding for the NHS and estimated prescribing cost, 2011/12 to 2015/16
![]()
Source: Data from NHS Digital excluding discounts and data from IFS
Going behind the headline figures: just how important are discounts?
For many, the headline statistics on prescription spend is where the analysis ends. For example, The Health Foundations’ March 2017 chart of the month plotted the cost of drugs for the NHS in England by sector and makes no mention of the difference between these statistics and real prices given the presence of discounts in the system. That’s not unreasonable: it’s hard to know just what the scale of discounts are.
Often discounts are confidential and come about through a variety of routes: discounts driven by procurement, Patient Access Schemes (PAS) - which are more often than not confidential price cuts (see figure 4) - discounts as part of the Cancer Drugs Fund (CDF), or simply competition in the market, where companies will try to compete not just on the quality of their product versus the alternatives, but the price too.
Figure 4: Types of Patient Access Schemes as at May 2017
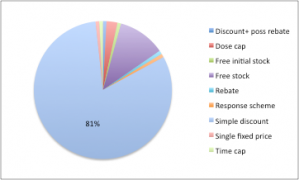
Source: Data from NICE. n= 117
A glimmer into the potential scale of discounting is given by formal meeting minutes from a PPRS meeting between the Department of Health and the Association of the British Pharmaceutical Industry (ABPI). The March 2016 meeting minutes note that IMS reported sales – at list prices - for the spend on branded medicines under the PPRS showed growth of 7.8% from 2014 to 2015. Company data – at real transaction prices – for the same time period fell by 0.2%. The ABPI put forward their view that discounting was a key driver of a gap between IMS and company data, alongside parallel imports.
The issue was picked up again in a September 2016 meeting where ABPI survey evidence suggested an increase in discounts in the last 4 years, including increased procurement activity, even on NICE approved medicines.
When spending is not the same as the cost: PPRS payments mean that the share of spend on medicines in the NHS has been stable
Not only do discounts affect real transaction prices and hence real spend by the NHS on drugs, but the 2014 PPRS introduced a cap on NHS spending on those drugs covered by the PPRS. Member companies pay back when the agreed growth rates for spending on branded medicines is breached. Contrary to some reports, PPRS payments are in the public domain. They have now reached over £1.7billion (see figure 5).
Figure 5: PPRS payments, 2013/14 to Q1 2016/17
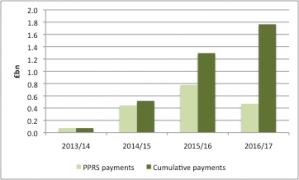
Source: Data from DH
The PPRS payments make an important difference between spend and the real cost to the NHS. According to Nicola Blackwood, Parliamentary Under-Secretary of State for Health, total drug spend net of PPRS payments in 2015/16 was 12.4 per cent.
[caption id="attachment_28212" align="alignnone" width="320"] Health minister Nicola Blackwood[/caption]
That compares to 14.3% using NHS Digital data and IFS data on the budget for the NHS. Not only that, but the share was 12.4% in 2010/11 according to Blackwood’s figures. That means that spending on medicines has pretty much stayed the same from 2010/11 to 2015/16.
Spend on medicines will still be the focus of value for money drives in the NHS
Even with discounts and PPRS payments – the latter being fragile in any case, as the 2014 scheme is due to close by the 31 December 2018 and its successor is not yet agreed – the amount spent on medicines will remain in focus. That’s because, even if a small part of NHS spending in relative terms, it remains important and where there is likely to be scope to spend more wisely. That’s the view of NHS England, who included getting the best value out of medicines and pharmacy as point four in its ten point plan for efficiency in the NHS.
However, targeting spend on medicines alone will not address the financial challenges of the NHS. Instead that’s a bigger debate about how much to spend on the NHS, as well as the efficiency of the almost 90% of NHS funding that is spent on other activities and services.
About the author:
Leela Barham is an independent health economist and policy expert who has worked with all stakeholders across the health care system, both in the UK and internationally. Leela works on a variety of issues: from the health and wellbeing of NHS staff to pricing and reimbursement of medicines and policies such as the Cancer Drugs Fund and Patient Access Schemes. Find out more here and contact Leela on leels@btinternet.com.