Graph power: life sciences lead in intelligent data use

Graph technology is allowing pharma to model data in a way that offers invaluable insights for marketing, R&D and compliance teams alike.
Google, Facebook and LinkedIn are among those utilising graph technology, which can model real-world relationships in a way that was not possible in the past.


(Left to right) Dharma Subramanian and Chitra Varma
But it is the life sciences industry that is leading the way in the adoption of this technology. It can share data seamlessly and uncover relationships hidden in broad ranges of data sets, making it invaluable to R&D and sales teams alike.
This article examines the advantages of graph technology over traditional databases and analytics, and considers what the future of data management in life sciences may hold.
Why graphs?
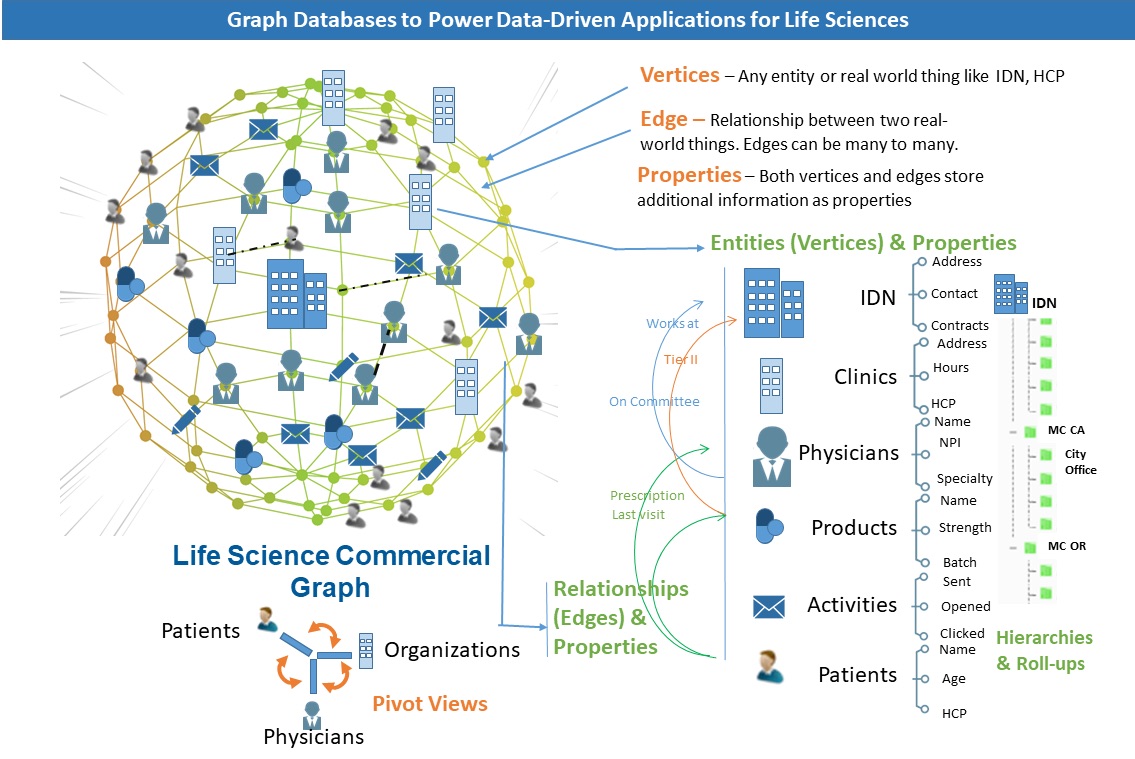
A graph is made up of nodes – real-life entities, like health care providers (HCPs), Integrated Delivery Networks (IDNs) and products – that can be connected to signify relationships. These may be employees, prescribers, or caregivers, with the number of nodes and relationships that can be entered unlimited.
This model can represent real-world relationships much more clearly than relational databases that have rigid schemas.
Leading consumer applications, like LinkedIn and Facebook, utilise graphs to easily identify and visualise complex relationships in a simple interface. This technology is an elegant, powerful way to solve complex data problems.
Being able to connect HCPs, products, healthcare organisations (HCOs) and locations in many-to-many relationships, reveals deeper insights than traditional databases.
Graph technology can quickly identify an HCP’s channel choice, content preferences, influence in a disease area, prescribed products and clinical trial participation, for example. The graph helps model the roll-up of dynamic hierarchical information, such as revenue, value, or prescription by site of care, and also aids in finding key influencers.
Graph technology can also play a significant role in entity resolution. For example, it can help identify an HCP engaging with different channels, or working at various locations as one, rather than multiple, people.
The power of the hybrid graph
Companies need a flexible, reliable data foundation that can handle information from internal, external and third-party data sources, and has big data scalability.
Commercial and medical teams want the power to uncover the relationships HCPs, key opinion leaders or key accounts have with various organisations, products and locations. Data models need to be updated quickly, without impacting on performance impact.
A columnar database cannot easily support relationships, which is a challenge for traditional relational-based master data management solutions. Introducing a new relationship in a relational database when business needs change is complicated and resource-intensive.
However, while graph databases are suited to managing relationships, they don’t have the scalability to incorporate interactions and transactions at big data level.
A polyglot approach (the idea that a single business application should be able to connect to different database types to create a business solution), with columnar-graph hybrid stores, is more suitable for applications with varying data storage needs. Moreover, it provides an agile approach, which offers the flexibility to model complex relationships without the burden of re-implementation when business needs change.
Modern data management platforms offer such a hybrid, which enables schema-on-read, graph relationship definition and infinite horizontal scalability across all business entities with limitless attributes.
Graph analytics for relevant insights
Modern data management platforms also provide mechanisms to ensure data reliability, integrity and governance, as well as matching appropriate data entities across multiple systems and devices.
Graph and big data analytics technologies make a powerful combination. Such technology can provide support for data science queries, graph analytics, window functions, percentile calculations, and advanced machine learning. It also offers advanced algorithms, such as page ranks, triangles, node connectivity and node degree, allowing users to learn more about the relationships between data entities. Teams can quickly determine top-selling drugs in target segments or group HCPs based on their speciality, locations and prescription profiles. They can analyse publications, clinical trial participation and speaking engagements to find key opinion leaders (KOLs).
Thanks to predictive analytics and machine learning, customer relationship management becomes agile and actionable in real time. Medical Science Liaison (MSL) teams can uncover new relationships quickly, and provide field teams with intelligent recommendations for effective consumer engagement.
Applications in life sciences
The use of graphs in life sciences allows commercial, medical and brand teams to gauge the influence of physicians, and their relationships and affiliations with hospitals and other institutions. This allows them to find HCPs who play a significant role in decision making.
Here are a few examples of how data-driven applications that leverage graph technology can provide better access and customer insights.
Affiliation management
Understanding professional and organisational relationships is crucial. Graph technology provides data-driven affiliation management of all relationships within and across HCOs and HCPs. This supports commercial opportunities by providing the ability to correlate plans, actions and results. Commercial teams get graphical views of HCP-to-HCO affiliations and HCP-to-HCP relationships, as well as legal structures of HCO-to-HCO hierarchies, including IDNs, hospitals, clinics, departments, labs and nursing homes.
Key account management (KAM)
Successful KAM strategy requires a convergence of information from all functional areas and applications and a keen understanding of the relationships across the account. Data-driven graph applications provide reliable data and recommend actions to develop and nurture relationships with targeted individuals. Account teams can measure and rank HCP influence against any criteria, and determine the value or credit risk of an account with hierarchy roll-ups.
Plan-payer management
With the healthcare industry’s focus on outcomes-based payers need to curtail the costs of expensive therapies and apply stringent rules to formulary access. With this technology, life sciences executives can easily see the relationship between formulary status and prescription data, which was traditionally stored in an inaccessible data warehouse. They can also find relationships between HCPs and payers, and target them speciality care drugs.
Key opinion leader (KOL) management
The success or failure of a clinical trial or product launch significantly depends on recruiting the right investigator or KOL. Graph technology provides full demographic profiles and affiliation, and an audit history of prior engagement and outcomes is readily available.
Compliance
Graph technology can support the allocation of training for the field force and account teams to comply with rules and regulations. This yields significant savings and improves productivity by proactively identifying reps who do and do not need training. It can also produce compliance reports that meet transparent reporting requirements.
Product brand management
Building a product master on a modern data management platform with graph relationships provides universal identification and complies with the US IDMP (Identification of Medicinal Products) by linking and synchronising product data across all sources. The graph becomes the single repository for all product master reference data, transaction and interaction data related to products, and even product intelligence from third-party data sources. It provides the definition of flexible product hierarchies by markets, brands, segments and geographies. This information can then be categorised, organised and analysed from multiple perspectives, and presented to the end user in the context most suited to their roles and objectives.
The applications of graphs in life sciences are extensive and impactful. The technology provides unprecedented visibility into the complex relationships among HCPs, HCOs, plans, payers, products and locations.
Once scattered across systems, now graphs make this information available to commercial, brand and medical teams in easy-to-use data-driven applications. Teams can quickly discover relationships, identify target customers and navigate complex hierarchies to execute their plans of action efficiently.
About the authors:
Dharma Subramanian is director, Applications, at Reltio, while Chitra Varma is global commercial leader at IQVIA.