Predicting pandemics with unconventional digital tools
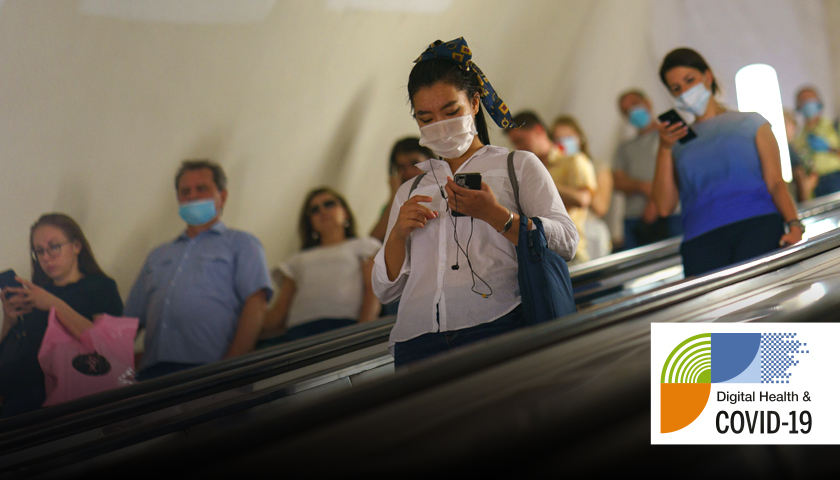
The world is awash with data, and while retailers and TV subscription services have perfected the art of collection and curation, public health has been trailing behind. But the advent of COVID-19 is proving to be something of a coming of age for digital epidemiology, which has been putting data from disparate sources to global use for the last 15 years.
Giving the Joseph Leiter lecture at this year’s virtual Medical Library Association (MLA) conference Harvard Medical School’s Professor John Brownstein spoke about embracing non-traditional data streams in public health.
Data inadequacies
Prof Brownstein, who is also chief innovation officer at Boston Children’s Hospital, said: “COVID-19 has put a real focus on the inadequacies of public health. At this moment, people recognise that monitoring infectious diseases, in the US or globally, is challenging because data takes time.
“People get sick, the data goes into health records, the laboratory confirmations end up in Centers for Disease Control (CDC) and the ministries of health, and eventually with world bodies. By the time you find out something is going on, it has taken weeks or months.”
Digital epidemiologists, he explained, think about how alternative, freely available data streams can “unwind the hierarchical information flow”.
“Many other industries have exploded because they've been able to access data,” he said. “If you're consuming news, shopping or travelling, all the data about you and people like you is used to help you make better decisions. That exists in almost every domain except for healthcare.”
Traditional healthcare data was often fragmented, siloed, and highly localised, he added.
“Traditional sources of data really can't cut it if you're trying to do real time surveillance on a global scale.”
Global data mining
The key is tapping into the multitude of data streams outside of the traditional healthcare sphere, he said.
“People move through the world and they have a digital exhaust. They search Google, they send out tweets, they shop on Amazon. Their Fitbit streams information about them.
“A subset of that digital exhaust is health related: health behaviours and health outcomes. If you start tapping into that data, you not only get insights for individuals, but if you start aggregating it at scale, you get some amazing insights about population-level events.”
Health Map is a 15-year old project that does just that. Established with funding from the National Library of Medicine (NLM), it pulls data from sources including news stories, blogs, social media, and chat rooms.
“We are ingesting hundreds of thousands of pieces of information daily and we tag that information across locations, disease types, species, and case counts. The idea is that if you can structure it you can get deep insights about disease outbreaks and populations,” said Prof Brownstein.
Health Map “churns through” as many sites as the team “can get their hands on”, then shares the organised, classified data on its website. A feed of the information also goes to the World Health Organization (WHO).
Emerging field
One of the project’s early successes was the identification of H1N1 in La Gloria, Mexico a decade ago, Prof Brownstein explained.
“The first sign of this new strain of swine flu came from a local news media source – it didn’t come from the ministry of health or the CDC. That really highlighted the fact that there was an opportunity to tap into these non-traditional sources to get early insights on a disease event.”
Even more importantly, he went on, it showed it was possible to capture the movement of a virus in real time and use that information to predict transmission patterns.
“With COVID-19, it's pretty commonplace to have that kind of data, but 10 years ago it wasn't necessarily the case,” he said.
During the H1N7 and H1N8 outbreaks, Health Map tapped into China’s social media sites Weibo and WeChat, where people were discussing cases and even sharing screenshots of their electronic health records.
The first signs of the emergence of Ebola came from networks of experts discussing cases online. What’s more, the team were able to connect the data with other sources of information, such as detailed passenger itinerary data related to the epicentre of the outbreak.
“You could then start to look at where you might expect transportation of cases and how to prioritise risk assessment for different locations outside of West Africa,” explained Prof Brownstein.
Digital COVID
This latest global health emergency has come at a time when digital epidemiologists have access to more data streams than ever before.
OpenTable, an online restaurant booking service, has become a “valuable source of understanding” around social distancing, and has even been used to model how well populations are handling lockdown, for example.
And symptom tracker apps, many of which feature self-assessment questionnaires, have helped take the discipline from data mining to direct data collection.
“We've seen a lot of these apps during COVID-19, but what's amazing is that they are providing an incredible level of diagnostic and triage accuracy,” said Prof Brownstein.
A detailed line list of cases, drawn from all available data sources, has also been made freely available on the Health Map website.
This huge undertaking, which will be used to “feed a variety of different intervention efforts and research tools”, started out as an informal network of volunteers, and now has Google funding and international backing.
“High resolution epidemiological data is incredibly important for modelling the spread within a country but also globally. Having access to that detailed data was so critical for the early models, and is now important for our ability to predict risk across the globe,” said Prof Brownstein.
Ultimately, the huge range of available data streams presents almost limitless opportunities in terms of disease surveillance and emergency response throughout COVID – and beyond.


